CASE STUDY
How MAPFRE turned learning into sales with isEazy

Brain
The first AI trained to teach

Author
The #1 AI-powered authoring tool on the market

Factory
Custom e-learning content factory

Skills
Comprehensive power skills course catalog

LMS
All-in-one LMS platform with AI

Engage
App for managing frontline teams
Product

What is Brain?
Everything you need to know about the first AI trained to teach.

How does it work?
Adaptive, conversational, and contextual. That’s learning with Brain.

Security
Why your company’s knowledge never leaves your environment or trains other models.

Comparison
Discover what sets isEazy Brain apart from other AI solutions.

Frequently Asked Questions
Want to learn more? Find answers to all your questions about isEazy Brain here.
FEATURES

AINew
Unlock your full potential and speed up course creation with artificial intelligence.

Accessibility
Automatically meet accessibility guidelines—without sacrificing interactivity!

Interactivity
Boost engagement with interactive, ready-to-use activities that make learning fun.

Course Creation
Reduce the time it takes to create your e-learning courses with our authoring tool.

Distribution
We offer you different distribution options, so that nothing can stop you.

SCORM
Publish your course in SCORM format and share it on any LMS.
SERVICES

Instrucional Design
Surprise your students with multimedia and interactive content.

Custom Courses
We create e-learning courses for you—tailored to your needs and hassle-free!

Virtual Reality
Turn learning into an immersive experience.

Custom Avatars
Give your courses and videos a unique touch with personalized avatars.

Audiovisual FactoryNew
Turn training into something dynamic and visual with engaging videos.
CATALOG

Course catalog
Over 600 skills and competency courses to help you adapt to your team's needs.
Microsoft Copilot AcademyNew
Your professionals will learn how to apply Copilot AI to key processes within your organization.

Artificial Intelligence Academy
Train your teams in the practical use of AI to boost productivity and innovation in your company.

Cybersecurity Academy
Capacita a tu empresa con el catálogo más completo en seguridad digital corporativa.
FEATURES

Learning platform
Manage all your training from one place

Analitycs
Measure the impact of your training

Learning Experience
Offer a unique learning experience to your team
Content Library
Choose from hundreds of expert-created courses
Authoring Tool
Create your own content—faster than ever

Use cases
Choose the solution that best fits your needs

Industries
Solutions for all types of industries
USE CASES

Onboarding
Facilitate the onboarding process, productivity and engagement of your new employees.

Upskilling
Boost your team's skills and prepare them for the challenges of the future with upskilling.

Microlearning
Discover all the advantages of microlearning and boost your training results.

Gamification
Enjoy addictive training that will get your professionals hooked.

Internal Communication
Improve communication in your company and enjoy an aligned and committed team.

Mobile learning
Agile, flexible, and interactive learning—built for today’s digital-first workforce.
INDUSTRIES

Banking and financial services
Training in compliance, cybersecurity, customer service, and key skills development.

Pharmaceuticals and healthcare
Digital onboarding, regulatory updates, and ongoing training for healthcare staff.

Retail and consumer
Agile and scalable training for in-store, operational, and customer service teams.

Industry and manufacturing
Training in processes, safety, and corporate culture for distributed teams.

Education and training
Digital solutions for training centers, internal academies, and corporate universities.

Technology and telecommunications
Development of technical talent, digital skills, and upskilling and reskilling programs.
CLIENTS

MAPFRE
How MAPFRE turn e-learning into sales with isEazy

Pepco
A personalised learning experience for a growing team.

BBVA
Digitisation and creation of high quality e-learning content.

Shiseido
We increase the engagement of the training with a social and gamified app.

Telefónica
Large-scale reskilling for the company's digital transformation.

Vodafone
A personalised learning experience for a growing team.
More than 1,000 companies already rely on isEazy.





MEET ISEAZY

Events
Discover our upcoming events and connect with the future of e-learning.

News
Find out the latest news about isEazy: press releases, partnerships, updates...

Contact
Leave us your personal details and we will contact you as soon as possible.
About isEazyNew
Find out more about our company.

Careers
We are looking for the best talent, join our team!

Partners
Become our partner and grow your business.
INTERESTING RESOURCES

Blog
The best content on e-learning: trends, tools and key strategies.

Whitepapers
Gain valuable insights and stay ahead of industry trends.

Product releases
The latest news and releases of our e-learning products and solutions.

Glossary
Definitions of the most commonly used terms and key industry concepts.

Guides
Discover the best step-by-step tips and tricks to optimize your L&D strategy.

Webinars
Video sessions on our products, trends and more

Comparatives
Compare e-learning solutions available on the market and choose the most suitable one.



September 17, 2026

CONTENT CREATED BY:

Table of contents
“Learning analytics” is the process of measuring, collecting, analyzing, and presenting data about learners and their contexts with the goal of understanding and optimizing learning. According to the Society for Learning Analytics Research (SoLAR), its purpose is to understand what happens during training, why it happens, and how to improve the environment in which it takes place. In e-learning, this means turning the data generated by every interaction with the platform — logins, time spent, results, drop-off patterns — into concrete improvement decisions.
In corporate training, “learning analytics” has become a key tool for L&D teams. According to the LinkedIn Workplace Learning Report 2024, 89% of learning leaders consider demonstrating the impact of their programs a priority, but only 27% measure the ROI of their initiatives systematically. “Learning analytics” is the discipline that closes that gap: it connects learning data with real business indicators.
“Learning analytics” operates in a continuous four-step cycle: data capture, storage, analysis, and action. In an e-learning environment, most of the data is generated automatically inside the LMS: every time an employee accesses a module, completes an activity, takes an assessment, or drops a course halfway through, that action is recorded.
This data is processed at two levels. At the individual level, it enables training tracking for each employee: what they have completed, where they struggle, and what they need reinforcement on. At the aggregate level, it reveals global patterns: which content causes the most drop-off, at what point in the course attention is lost, and which employee groups show skill gaps. By combining both perspectives, the L&D team can make evidence-based decisions instead of relying on intuition.
The most common technical standard for capturing data in e-learning is xAPI, which allows learning activities to be recorded beyond the LMS. For organizations working with SCORM — the classic standard — the LMS itself already collects enough essential metrics to start applying analytics.
Not all data holds the same value. “Learning analytics” works with three main categories that, combined, offer a complete view of the training process:
| Data Type | Concrete Examples | What It's For |
|---|---|---|
| Activity data | Time per module, completion rates, number of attempts, drop-off points | Identifying bottlenecks and content that fails to engage |
| Outcome data | Assessment scores, percentage of correct answers per question, progress across attempts | Measuring knowledge transfer and real progress |
| Context data | Employee role, department, tenure, prior training history | Personalizing recommendations and comparing performance across groups |
“Learning analytics” is not a single technique but a spectrum of capabilities ranging from the most basic to the most sophisticated. Most L&D teams start at the descriptive level and progress gradually as the program matures and more tools become available:
| Level | What It Answers | Example Use |
|---|---|---|
| Descriptive | What happened? | 34% of sales employees did not complete the product module within the set deadline |
| Diagnostic | Why did it happen? | The longest module (45 min) has a 60% drop-off rate at minute 20 |
| Predictive | What will happen? | Employees who fail the initial assessment have a 70% probability of not completing the course |
| Prescriptive | What should we do? | Recommend a reinforcement microlearning format to employees scoring below 60 on the pretest |
For “learning analytics” to work, learning data must be captured in a structured, comparable way. In the e-learning ecosystem there are two main standards:
For most organizations with structured corporate training, SCORM combined with native LMS analytics offers a solid starting point without the need for additional infrastructure.
Applied systematically, “learning analytics” transforms the way training teams design, adjust, and justify their programs:
“Learning analytics” is a powerful tool, but it’s not infallible. Before implementing it, it’s worth keeping its limitations in mind:
One of the most strategic uses of “learning analytics” is demonstrating the economic value of training investment. When learning data is cross-referenced with business indicators — productivity, time to autonomy, error reduction, retention rates — it becomes possible to build a quantifiable case for L&D’s impact.
The most widely used model for this purpose is Kirkpatrick’s (four levels: reaction, learning, behavior, results), which requires exactly the type of data analytics collects: participant satisfaction, assessment results, behavior change, and business metrics. To dig deeper into how to rigorously measure training ROI, it’s essential to have a data collection strategy from the program’s design stage.
MAPFRE is a great example of how analyzing training data can transform a program’s effectiveness at corporate scale. With staff spread across multiple countries, the insurer used isEazy to centralize and analyze data from its training programs, identifying which learning paths directly impacted sales indicators. Discover how they did it →
isEazy LMS includes a built-in analytics dashboard that gives training managers real-time access to their programs’ key metrics: completion rates, results per module, group comparisons, and trends over time. Data is collected automatically through SCORM with no additional configuration needed, meaning any course created with isEazy Author generates analytics data from the very first access.
If you want to see it in action, explore isEazy LMS and discover how the most demanding L&D teams turn learning data into more effective training programs.
WHITEPAPER
How to take your in-person training online with the right authoring tool


Standard LMS reports show basic data: who completed a course, what grade they received, and how long it took. Learning analytics goes further: it combines that data with contextual information (employee role, department, training history) and analyzes it systematically to identify patterns, predict behaviors, and drive improvement decisions. While reports describe what happened, learning analytics explains why it happened and what to do next. In practice, an LMS with learning analytics capabilities can identify which module has the highest drop-off rate, where employees lose focus during a course, or which learner profiles need reinforcement before an assessment.
Not necessarily. While xAPI enables data capture from multiple sources beyond the LMS, most L&D teams can start with the data their platform already generates: completion rates, assessment results, time per module, and access patterns. The starting point is not the technology — it is defining which questions you want to answer with data. A modern LMS with SCORM support and a built-in analytics dashboard already provides enough information to make meaningful improvement decisions. The key is interpreting that data with purpose and connecting it to concrete business objectives.
The most practical starting point is to choose 2 or 3 concrete indicators aligned with real business goals: for example, the completion rate of an onboarding program, the average assessment score by department, or the average time to competency for a key skill. With those KPIs defined, it is enough to review LMS reports periodically, compare results across groups and time periods, and act on the differences detected. No statistics expertise is needed: learning analytics begins as a practice of systematic data reading, not a technology project. As the team matures, more complex analyses and dedicated dashboards can be incorporated.

Automate processes, access 600+ ready-to-use courses, or create your own content with the help of AI.
Request a demoContact us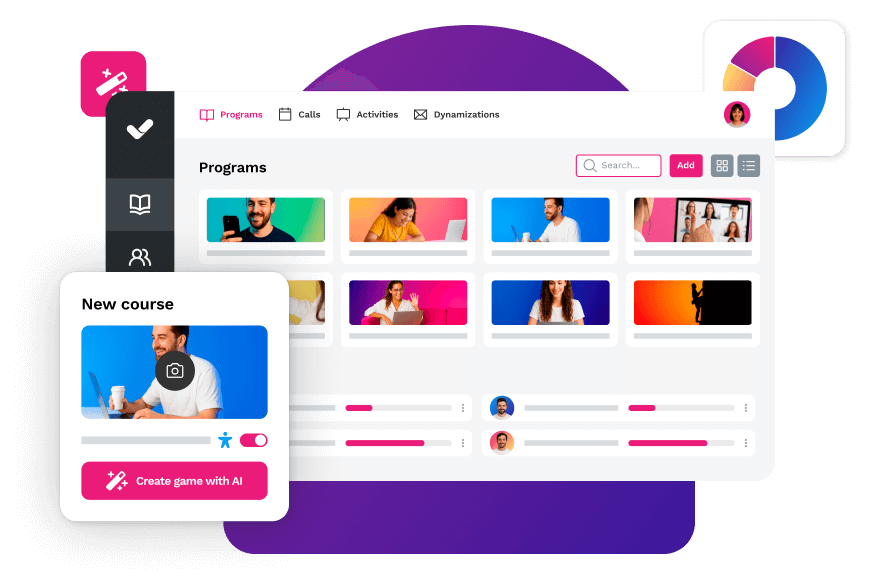

An LMS to manage and track learning across your entire team
Measure its impact by individual, department, region, or company-wide. Everything you need to power up your training strategy.