The first AI trained to teach

Brain
The first AI trained to teach

Author
The #1 AI-powered authoring tool on the market

Factory
Custom e-learning content factory

Skills
Comprehensive power skills course catalog

LMS
All-in-one LMS platform with AI

Engage
App for managing frontline teams
Discover isEazy Brain


Product
What is Brain?
Everything you need to know about the first AI trained to teach.
How does it work?
Adaptive, conversational, and contextual. That’s learning with Brain.
Security
Why your company’s knowledge never leaves your environment or trains other models.
Comparison
Discover what sets isEazy Brain apart from other AI solutions.
Frequently Asked Questions
Want to learn more? Find answers to all your questions about isEazy Brain here.
Discover isEazy Author


 See all features
FEATURES
AINew
Unlock your full potential and speed up course creation with artificial intelligence.
Accessibility
Automatically meet accessibility guidelines—without sacrificing interactivity!
Interactivity
Boost engagement with interactive, ready-to-use activities that make learning fun.
Course Creation
Reduce the time it takes to create your e-learning courses with our authoring tool.
Distribution
We offer you different distribution options, so that nothing can stop you.
SCORM
Publish your course in SCORM format and share it on any LMS.
Discover isEazy Factory


SERVICES
Instrucional Design
Surprise your students with multimedia and interactive content.
Custom Courses
We create e-learning courses for you—tailored to your needs and hassle-free!
Virtual Reality
Turn learning into an immersive experience.
Custom Avatars
Give your courses and videos a unique touch with personalized avatars.
Audiovisual FactoryNew
Turn training into something dynamic and visual with engaging videos.
Discover isEazy Skills


CATALOG
Course catalog
Over 600 skills and competency courses to help you adapt to your team's needs.
Microsoft Copilot AcademyNew
Your professionals will learn how to apply Copilot AI to key processes within your organization.
Artificial Intelligence Academy
Train your teams in the practical use of AI to boost productivity and innovation in your company.
Cybersecurity Academy
Capacita a tu empresa con el catálogo más completo en seguridad digital corporativa.
Discover isEazy LMS


FEATURES
Learning platform
Manage all your training from one place
Analitycs
Measure the impact of your training
Learning Experience
Offer a unique learning experience to your team
Content Library
Choose from hundreds of expert-created courses
Authoring Tool
Create your own content—faster than ever

Use cases
Choose the solution that best fits your needs

Industries
Solutions for all types of industries
See all solutions


 See all solutions
USE CASES
Onboarding
Facilitate the onboarding process, productivity and engagement of your new employees.
Upskilling
Boost your team's skills and prepare them for the challenges of the future with upskilling.
Microlearning
Discover all the advantages of microlearning and boost your training results.
Gamification
Enjoy addictive training that will get your professionals hooked.
Internal Communication
Improve communication in your company and enjoy an aligned and committed team.
Mobile learning
Agile, flexible, and interactive learning—built for today’s digital-first workforce.
Discover our industries


 View all industries
INDUSTRIES
Banking and financial services
Training in compliance, cybersecurity, customer service, and key skills development.
Pharmaceuticals and healthcare
Digital onboarding, regulatory updates, and ongoing training for healthcare staff.
Retail and consumer
Agile and scalable training for in-store, operational, and customer service teams.
Industry and manufacturing
Training in processes, safety, and corporate culture for distributed teams.
Education and training
Digital solutions for training centers, internal academies, and corporate universities.
Technology and telecommunications
Development of technical talent, digital skills, and upskilling and reskilling programs.
CLIENTS

MAPFRE
How MAPFRE turn e-learning into sales with isEazy

Pepco
A personalised learning experience for a growing team.

BBVA
Digitisation and creation of high quality e-learning content.

Shiseido
We increase the engagement of the training with a social and gamified app.

Telefónica
Large-scale reskilling for the company's digital transformation.

Vodafone
A personalised learning experience for a growing team.
More than 1,000 companies already rely on isEazy.





MEET ISEAZY

Events
Discover our upcoming events and connect with the future of e-learning.

News
Find out the latest news about isEazy: press releases, partnerships, updates...

Contact
Leave us your personal details and we will contact you as soon as possible.
About isEazyNew
Find out more about our company.

Careers
We are looking for the best talent, join our team!

Partners
Become our partner and grow your business.
INTERESTING RESOURCES

Blog
The best content on e-learning: trends, tools and key strategies.

Whitepapers
Gain valuable insights and stay ahead of industry trends.

Product releases
The latest news and releases of our e-learning products and solutions.

Glossary
Definitions of the most commonly used terms and key industry concepts.

Guides
Discover the best step-by-step tips and tricks to optimize your L&D strategy.

Webinars
Video sessions on our products, trends and more

Comparatives
Compare e-learning solutions available on the market and choose the most suitable one.


WEBINAR
AI-powered course creation, step by step
Master AI in isEazy Author in under an hour.

05/11/2026

11:00 AM ET



GUIDE
Does your training plan comply with the EU AI Act?
Prepare your organization to comply with the new AI regulations

Subscribe to our newsletter
Stay up to date with all our latest news
 Subscribe to our newsletter
 Stay up to date with all our latest news

June 24, 2026
L&D Metrics for 2026: The Strategic Guide to Measuring Training Impact

CONTENT CREATED BY:
Yolanda Amores
Chief Marketing Officer at isEazy

Table of contents
What are L&D metrics and why are they important?
L&D metrics (Learning & Development) are quantifiable indicators that measure the efficiency, effectiveness and impact of corporate training programs. They cover everything from operational data — such as cost per learner or completion rate — to strategic indicators that connect learning with business outcomes: productivity, talent retention, error reduction and return on investment (ROI).
In today’s business landscape, measuring training is no longer optional. According to LinkedIn Learning’s Workplace Learning Report 2024, 72% of L&D leaders say that demonstrating the impact of training on the business is their top priority. Organizations that adopt a data-driven approach to managing their learning strategy make faster decisions, optimize their budgets and align every program with the company’s strategic objectives.
How L&D metrics connect training with business objectives
Training metrics act as a bridge between learning activity and business results. Without them, investment in L&D is perceived as a cost that is hard to justify. With them, every program becomes a strategic lever that contributes to concrete goals: improving customer satisfaction, accelerating the time-to-productivity of new employees, or reducing turnover in critical areas.
This approach enables L&D leaders to answer key questions in front of senior management: how much does it cost to train an employee? What impact does training have on performance? In which areas is learning generating real value? By linking each initiative to a business KPI, the L&D department stops being a cost center and becomes a strategic partner in organizational growth.
The role of metrics in improving employee development
Metrics are not only useful for reporting to management — they are continuous improvement tools for the L&D team itself. By analyzing data on engagement, satisfaction, pass rates and on-the-job application, training managers can identify what programs work, which ones need adjustments and where skill gaps exist that require new learning pathways.
When measured consistently, metrics reveal patterns: whether certain profiles drop out mid-course, whether interactive content generates better retention, or whether training in specific competencies is impacting team productivity indicators. This visibility is the foundation for designing increasingly effective learning experiences.
Key categories of L&D metrics
To effectively evaluate training success, it is essential to understand the main categories of employee training metrics, which are typically divided into three main areas:
- Cost and efficiency metrics: assess how training resources are used (budget, time, infrastructure).
- Engagement and learning effectiveness metrics: measure participation levels, satisfaction and knowledge retention.
- Business and performance metrics: connect training results with business indicators (productivity, retention, ROI).
This three-category framework allows the L&D team to offer a complete picture of the value of training: from operational efficiency to its direct contribution to the business.
Essential L&D metrics to track
Below are the key L&D metrics organized by category. Each one includes its definition and practical value for decision-making.
Cost and efficiency metrics
- Cost per learner: total training spend divided by the number of participants. Enables comparison of the efficiency of different programs or providers.
- Completion rate: percentage of employees who complete a program compared to those who start it. According to the Association for Talent Development (ATD), the sector average is around 70–80% for online corporate training.
- Average training time: hours dedicated per employee per period. Useful for balancing the training workload without impacting daily productivity.
- Resource utilization rate: measures what percentage of contracted licenses, content or platforms are actively used. A low rate signals oversizing or low adoption.
| Metric | What it measures | Formula or calculation |
|---|---|---|
| Cost per learner | Training spend efficiency | Total spend / Number of participants |
| Completion rate | Percentage who complete the program | (Completions / Enrolments) x 100 |
| Learner engagement | Active participation in training | Logins + interactions / total learners |
| Satisfaction (NPS) | Perception of program quality | Post-training survey (0-10 scale) |
| Pass rate | Knowledge retention | (Passes / Assessed) x 100 |
| Time-to-productivity | Speed of on-the-job application | Days from end of training to standard performance |
| Training ROI | Return on investment | (Net benefit - Cost) / Cost x 100 |
| Post-training retention rate | Impact on staff turnover | 12-month retention of trained vs. untrained employees |
Engagement and learning effectiveness metrics
- Learner engagement: measures the level of active participation of employees in training — logins, time on platform, interactions with content — providing insights into the effectiveness of the instructional design.
- Training experience satisfaction: feedback collected through post-training surveys (NPS, Likert scale) indicates which areas need improvement and helps increase learner loyalty.
- Pass rates and assessment scores: performance in tests and exercises shows how well employees have internalized the knowledge. According to Deloitte (Global Human Capital Trends 2024), organizations with assessments integrated into their LMS are 23% more likely to report improved performance.
- Medium-term knowledge retention: follow-up assessments weeks or months after training to measure how much content is retained and applied on the job.
Business and performance metrics
- Training ROI: compares the net benefit achieved (productivity improvements, error reduction, lower turnover) against the total investment of the program. It is the metric most demanded by senior management.
- Productivity impact: measurable change in team performance after training (units produced, tickets resolved, response times).
- Error and incident reduction: decrease in operational failures, customer complaints or regulatory non-compliance linked to specific training programs.
- Employee retention rate: correlation between participation in development programs and organizational tenure. According to Gallup, companies with strong upskilling strategies reduce turnover by up to 21%.
- Time-to-productivity: time it takes a new employee to reach the standard performance level for their role, directly influenced by the quality of the employee training program.
Only 8% of CEOs perceive a clear impact of corporate training on business results — highlighting the gap between L&D investment and the ability to measure it.
McKinsey & Company, 2024
Emerging trends and advanced L&D metrics for 2026
The landscape of measurement in corporate training is evolving rapidly. These are the three trends that will make the biggest difference for the most mature L&D departments in 2026.
1. Powering learning analytics with AI to transform training strategy
Artificial intelligence is redefining how training data is analyzed. Learning analytics tools powered by AI make it possible to process large volumes of data in real time, detect learner behavior patterns and automatically generate personalized recommendations.
Solutions like isEazy Brain represent this new generation of learning technology. Brain enables L&D teams not only to measure what each employee learns, but to understand how they learn and where they need reinforcement — all with human oversight and EU AI Act compliance.
The combination of predictive analytics and AI applied to learning makes it possible to move from descriptive dashboards (what happened) to prescriptive models (what to do next), elevating the L&D function to a truly strategic level.


2. Measuring behavior change and on-the-job application
Beyond knowledge retention, measuring behavior change and the practical application of skills in the workplace will become increasingly important. The most advanced organizations use 360° assessments, direct manager observation and operational indicator analysis to evaluate how employees apply the skills they have learned.
This approach connects training with Level 3 of the Kirkpatrick model (behavior) and demonstrates that learning does not stay in the virtual classroom — it transfers to day-to-day performance.
3. Predictive metrics: forecasting training impact and skill gaps
Predictive analytics makes it possible to anticipate future training needs based on current skill gaps, turnover patterns and business objectives. This proactive approach enables L&D teams to design programs that address anticipated challenges, keeping employees competitive in a constantly evolving labor market.
Organizations that integrate predictive metrics into their training strategy are able to anticipate skills obsolescence, prioritize upskilling and reskilling investments, and demonstrate to management that L&D doesn’t just react to needs — it anticipates them.
2. Measuring behavior change and on-the-job application
Beyond knowledge retention, measuring behavior change and the practical application of skills in the workplace is becoming increasingly important. The most advanced organizations use 360° assessments, direct manager observation and operational indicator analysis to evaluate how employees apply the skills they have learned.
This approach connects training with Level 3 of the Kirkpatrick model (behavior) and demonstrates that learning does not stay in the virtual classroom — it transfers to day-to-day performance.
3. Predictive metrics: forecasting training impact and skill gaps
Predictive analytics can help anticipate future training needs based on current skill gaps and business objectives. This proactive approach enables L&D teams to design training programs that address anticipated challenges, keeping employees competitive in a constantly evolving labor market.
x
How to collect reliable training data
The success of your training program depends largely on the quality of the data you collect. Without reliable data, L&D metrics lose their ability to guide decisions. Here are two essential sources for building a solid data foundation.
Leveraging learning management systems (LMS)
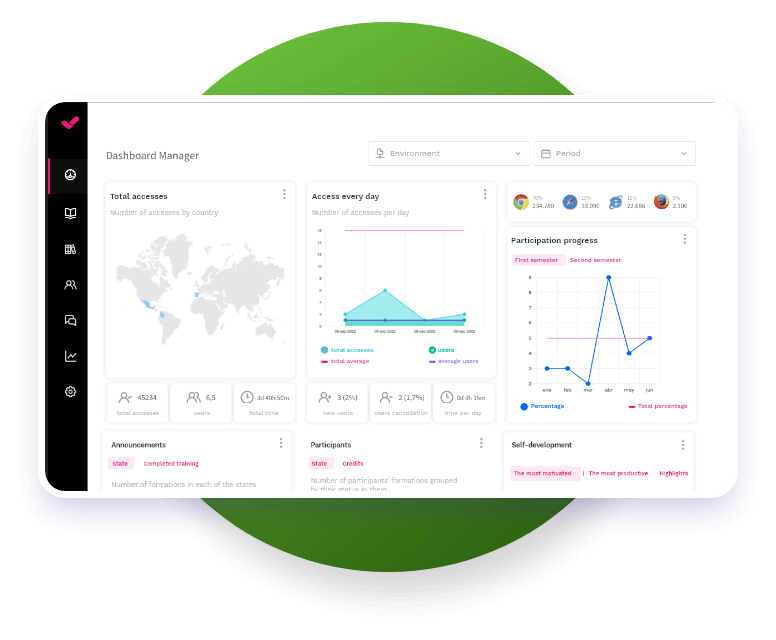
An LMS like isEazy LMS centralizes and automates the collection of training data: completion rates, assessment scores, login times, module-by-module progress and access patterns. These platforms generate real-time reports and enable data segmentation by department, location, profile or program, facilitating the granular analysis that L&D teams need.
The key is to configure indicators correctly from the design of the program: define what is going to be measured before launching training, not after. Organizations that integrate their LMS with HR analytics tools gain a complete picture of impact, connecting learning data with performance, retention and job satisfaction metrics.
Incorporating manager and performance data
Combining LMS data with managers’ perspectives adds an essential qualitative dimension. Team managers can evaluate the practical application of acquired skills, detect behavior changes and validate whether training is solving real day-to-day challenges.
Performance appraisals, 1:1 meetings and operational area indicators (productivity, errors, response times) are complementary sources that enrich the analysis. This holistic view allows for more accurate identification of skill gaps and helps adjust programs accordingly.
Common mistakes when measuring training impact
Even organizations that measure their training can fall into traps that distort results and limit decision-making. These are the most common mistakes and how to avoid them:
- Measuring only completion rates: completing a course does not mean anything was learned or applied. Completion rates are activity metrics, not impact metrics. They must always be complemented with knowledge assessments and post-training follow-up.
- Not aligning metrics with business objectives: if L&D measures learner satisfaction but management expects productivity data, a disconnect arises that erodes the department’s credibility. Every program should have KPIs tied to business outcomes.
- Ignoring qualitative data: surveys, manager interviews and on-the-job observation provide context that numbers alone cannot give. A program with strong quantitative metrics but poor practical application has an invisible problem.
- Not segmenting by profile or department: the same program may work perfectly in one department and fail in another. Analyzing data in aggregate hides these differences and makes optimization harder.
- Measuring only once: training is a process, not an event. Evaluating only at the end of a course misses medium-term retention and transfer to the workplace.
Aligning L&D metrics with stakeholder needs
Each level of the organization needs different metrics to make informed decisions. Adapting data communication to each stakeholder’s profile is key to positioning L&D as a strategic function.
For executives and senior leadership: executives need a clear picture of training ROI and its correlation with business results. Strategic summaries that link training investment with measurable improvements in productivity, retention or customer satisfaction are the most effective format.
For program managers and L&D leaders: they need detailed data to assess the effectiveness of each program and identify operational issues. Metrics such as module-level performance, drop-off rates at specific points in the learning pathway and satisfaction broken down by cohort allow them to optimize in real time.
For team managers: they need to know whether training is impacting the performance of their team members. On-the-job application metrics, observed behavior change and correlation with area indicators are the most relevant for this profile.
How to build an L&D metrics dashboard step by step
A well-designed dashboard is the tool that turns training data into decisions. Here are the steps to build one:
- Define the dashboard’s objectives: who is it for? What questions should it answer? A dashboard for senior management will be very different from one for the L&D team.
- Select the key metrics (max. 8–10): choose the KPIs that truly matter for your context. Less is more: a data-saturated dashboard does not get consulted.
- Connect data sources: integrate your LMS, your HR system and your assessment tools to get a unified view. An LMS with integrated analytics like isEazy LMS simplifies this integration.
- Set the update frequency: operational metrics (completion, logins) can be updated in real time; impact metrics (ROI, retention) require quarterly or biannual cycles.
- Include benchmarks and targets: without a reference point, data has no voice. Compare against previous periods, sector averages or defined targets.
- Automate reports: reduce manual work so the L&D team can spend its time analyzing and interpreting, not collecting data.
A good dashboard does not show everything: it shows what matters. Start simple, iterate based on stakeholder feedback and adjust metrics as your measurement strategy matures.
Driving continuous improvement and ROI with training metrics
L&D metrics are not a one-off exercise — they are an engine for continuous improvement. Each measurement cycle should feed the next: data from a completed program informs the design of the next one, dropout patterns reveal redesign opportunities and correlations with business indicators help refine the investment.
To maximize training ROI, the most mature L&D teams apply these principles:
- Define business KPIs before designing the program, not after.
- Conduct pre- and post-training assessments to quantify real learning.
- Follow up at 30, 60 and 90 days to measure transfer to the job.
- Cross-reference training data with performance, turnover and job satisfaction metrics.
- Communicate results in the language of the business: revenue impact, cost savings, risk reduction.
The key is to close the loop: measure → analyze → improve → measure again. Organizations that do this systematically ensure that every euro invested in training generates a growing and demonstrable return.
MAPFRE is an example of how measuring training impact can transform the results of a commercial team. With isEazy, the global insurer was able to directly link its training strategy to sales and team engagement indicators, demonstrating the real return on its L&D investment. Find out how they did it →


Unlock your full potential with L&D metrics
In 2026, the difference between an L&D department that survives and one that leads organizational strategy lies in its ability to measure, analyze and communicate the impact of training. L&D metrics are not a technical add-on: they are the language through which training demonstrates its value to leadership.
The good news is that you do not need to start measuring everything at once. Begin with the metrics that matter most to your business, connect your LMS with your organization’s performance indicators and build a continuous improvement cycle that elevates corporate training to its true potential.
If you are looking for a solution that integrates content creation, learning management and advanced AI-powered analytics in a single ecosystem, try isEazy for free and discover how to turn your training data into strategic decisions.
Frequently asked questions about L&D metrics
What are L&D metrics and why are they important for my company?
L&D (Learning & Development) metrics are quantifiable indicators that measure different aspects of training — such as efficiency, engagement, knowledge retention and business results. They are key to ensuring that the investment in training is aligned with the organization’s strategic objectives and generates a demonstrable return.
How can I link training results to business objectives?
You can do this through metrics such as post-training performance, customer satisfaction, productivity or operational efficiency. These data points show how training directly impacts business results, enabling L&D to position itself as a strategic partner to the organization.
Which metrics should I prioritize to evaluate training effectiveness?
The most relevant metrics are:
- Pass rates and assessment scores
- Knowledge retention
- Engagement levels
- Time to proficiency
- Training ROI
These metrics provide a balanced view of learning success and its impact on performance.
What tools help me collect reliable L&D data?
Modern LMS platforms such as isEazy LMS allow you to centralize and automate data collection. They offer real-time tracking of progress, participation and course completion, making it easier to evaluate training effectiveness and support data-driven decisions.
How can predictive analytics improve our training strategy for 2026?
Predictive analytics allows you to anticipate training needs based on current skill gaps and business objectives. This proactive approach helps L&D teams design programs that address future challenges, keeping employees competitive in a constantly evolving labor market.
Featured articles



GUIDE
Does your training plan comply with the EU AI Act?
Prepare your organization to comply with the new AI Regulations
Download guide


Streamline your training management
Experience the power of AI in an LMS that has it all


Streamline your training management
Experience the power of AI in an LMS that has it all
Related articles

Cristina Sánchez
May 18, 2026
Multidisciplinary Teams: Definition, Roles and How to Manage Them
Read more

Fernando González Zurita
June 5, 2025
The Ultimate Guide to LMS Support Services: Types, Benefits, and How to Choose the Right Vendor
Read more

Sara De la Torre
May 20, 2025
Multimodal learning: what it is, scientific evidence, and how to apply it in corporate training 2026
Read more