
WEBINAR ONDEMAND
How to create e-learning courses adapted to different types of learning with AI

Author
The #1 AI-powered authoring tool on the market

Factory
Custom e-learning content factory

Skills
Comprehensive power skills course catalog

LMS
All-in-one LMS platform with AI

Engage
App for managing frontline teams

Game
Gamification app for business
FEATURES

AINew
Unlock your full potential and speed up course creation with artificial intelligence.
Accessibility
Automatically meet accessibility guidelines—without sacrificing interactivity!

Interactivity
Boost engagement with interactive, ready-to-use activities that make learning fun.

Course Creation
Reduce the time it takes to create your e-learning courses with our authoring tool.

Distribution
We offer you different distribution options, so that nothing can stop you.

SCORM
Publish your course in SCORM format and share it on any LMS.
SERVICES

Instrucional Design
Surprise your students with multimedia and interactive content.

Custom Courses
We create e-learning courses for you—tailored to your needs and hassle-free!

Virtual Reality
Turn learning into an immersive experience.

Custom Avatars
Give your courses and videos a unique touch with personalized avatars.

Audiovisual FactoryNew
Turn training into something dynamic and visual with engaging videos.
CATALOG
Course catalog
Over 600 skills and competency courses to help you adapt to your team's needs.

Microsoft Copilot AcademyNew
Your professionals will learn how to apply Copilot AI to key processes within your organization.
Artificial Intelligence Academy
Train your teams in the practical use of AI to boost productivity and innovation in your company.

Cybersecurity Academy
Capacita a tu empresa con el catálogo más completo en seguridad digital corporativa.
FEATURES

Quizzes & Games
Turn your training into an engaging Q&A game.

Challenges & Competitions
Enhance learning through friendly peer challenges.
Rewards & Incentives
Motivate employees with points, levels, and leaderboards.
Social & Collaborative
Strengthen team connections with interactive social dynamics.

KPIs & Analytics
Track and optimize your training initiatives instantly and effortlessly.

Use cases
Choose the solution that best fits your needs

Industries
Solutions for all types of industries
USE CASES
Onboarding
Facilitate the onboarding process, productivity and engagement of your new employees.
Upskilling
Boost your team's skills and prepare them for the challenges of the future with upskilling.
Microlearning
Discover all the advantages of microlearning and boost your training results.
Gamification
Enjoy addictive training that will get your professionals hooked.

Internal Communication
Improve communication in your company and enjoy an aligned and committed team.

Mobile learning
Agile, flexible, and interactive learning—built for today’s digital-first workforce.
INDUSTRIES

Banking and financial services
Training in compliance, cybersecurity, customer service, and key skills development.

Pharmaceuticals and healthcare
Digital onboarding, regulatory updates, and ongoing training for healthcare staff.

Retail and consumer
Agile and scalable training for in-store, operational, and customer service teams.

Industry and manufacturing
Training in processes, safety, and corporate culture for distributed teams.

Education and training
Digital solutions for training centers, internal academies, and corporate universities.

Technology and telecommunications
Development of technical talent, digital skills, and upskilling and reskilling programs.
CLIENTS

MAPFRE
How MAPFRE turn e-learning into sales with isEazy

Pepco
A personalised learning experience for a growing team.

BBVA
Digitisation and creation of high quality e-learning content.

Shiseido
We increase the engagement of the training with a social and gamified app.

Telefónica
Large-scale reskilling for the company's digital transformation.
Vodafone
A personalised learning experience for a growing team.
More than 1,000 companies already rely on isEazy.


MEET ISEAZY

News
Find out the latest news about isEazy: press releases, partnerships, updates...

Contact
Leave us your personal details and we will contact you as soon as possible.
About isEazyNew
Find out more about our company.
Careers
We are looking for the best talent, join our team!

Partners
Become our partner and grow your business.
INTERESTING RESOURCES

Blog
The best content on e-learning: trends, tools and key strategies.
Whitepapers
Gain valuable insights and stay ahead of industry trends.
Product releases
The latest news and releases of our e-learning products and solutions.

Glossary
Definitions of the most commonly used terms and key industry concepts.
Guides
Discover the best step-by-step tips and tricks to optimize your L&D strategy.
Webinars
Video sessions on our products, trends and more

Comparatives
Compare e-learning solutions available on the market and choose the most suitable one.
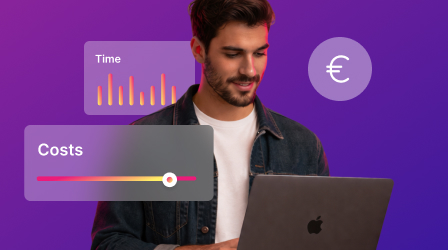
Calculate how much time and money you can save by creating courses with AI Autopilot.

Stay up to date with all our latest news
 Subscribe to our newsletter
 Stay up to date with all our latest news

February 20, 2026
CONTENT CREATED BY:

Table of contents
Visual thinking is a communication and learning technique that transforms complex ideas into clear and easy-to-understand visual representations. Discover how this methodology can revolutionize the way you learn, teach, and communicate information.
Visual thinking is a methodology that uses graphic elements such as drawings, icons, diagrams, concept maps, and symbols to organize, understand, and communicate information more effectively than plain text.
This technique leverages the human brain’s natural ability to process visual information. According to studies in cognitive neuroscience, we process images up to 60,000 times faster than text, which explains why visual thinking is so effective for learning and information retention.
As explained by Garbiñe Larralde, a leading figure in Visual Thinking: “Visual thinking involves understanding information through the structured visualization of its parts”. This definition highlights three key elements:
Visual thinking serves multiple purposes:
This methodology, widely used in different fields—especially in traditional and corporate learning—has several key characteristics, which we will explore below:
Visual thinking turns dense information into simple and understandable representations. It is not about creating perfect illustrations, but about capturing the essence of ideas through basic strokes, geometric shapes, and universal symbols.
It organizes information into levels of importance using:
Visual thinking works in a variety of contexts:
It does not require advanced artistic skills. Anyone can apply visual thinking using basic shapes, simple arrows, and keywords, democratizing this powerful communication tool.

Some of the advantages of visual thinking across different areas of application are:
WEBINAR ONDEMAND
How to create e-learning courses adapted to different types of learning with AI


You already know what it means, its advantages, and its applications. But how is this methodology put into practice? Here’s how:
Mind maps are the most popular visual thinking technique. They are built from a central idea placed in the middle, creating radial branches that represent main topics and sub-branches with details.
Unlike mind maps, concept maps use more formal hierarchical structures to represent how concepts interrelate within complex systems.
It combines text, simple drawings, lettering, and graphic elements to capture information during presentations, meetings, or classes in real time.
It uses visual sequences to tell stories, explain processes step by step, or plan experiences, providing a logical and temporal visual narrative.
Training applications:
They represent data, statistics, and complex concepts through attractive visual design, combining icons, charts, illustrations, and hierarchized text.
They visualize chronological events, process evolution, or historical development in a linear or creative way.
They represent processes, decisions, and workflows using standardized symbols, eliminating ambiguities in the communication of procedures.

Objective: Capture all relevant information without filters.
Actions:
Useful tools: Post-its, lists, voice recordings, screenshots.
Objective: Identify and select the essential information.
Actions:
Key balance: Keep enough information to be useful, but not so much that it becomes overwhelming.
Objective: Transform words and ideas into visual representations.
Actions:
Fundamental principle: simplicity above all. Less is more.
Objective: Ensure your representation communicates effectively.
Validation actions:
Success criterion: Your visual representation should communicate on its own, without requiring extensive additional explanations.
To implement this methodology, there are certain tools that can be useful. Below are some of them:
isEazy Author positions itself as the most comprehensive professional solution for applying visual thinking in the context of corporate training and e-learning. This authoring platform allows you to:

Key features for visual thinking
Specific advantages
Ideal for
Key features for visual thinking
Specific advantages
Ideal for
Articulate Storyline 360 is an advanced authoring tool that enables the application of visual thinking through an approach closer to interactive design and visual storytelling, with a high level of control over each on-screen element.

Key features for visual thinking
Specific advantages
Ideal for
Key features for visual thinking
Specific advantages
Ideal for
Adobe Captivate is an authoring tool focused on creating visual and immersive learning experiences, especially useful when visual thinking is applied to processes, systems, or technical environments.

Key features for visual thinking
Specific advantages
Ideal for
Key features for visual thinking
Specific advantages
Ideal for
If you are looking for a tool that combines power, ease of use, and a specific focus on visual thinking in training, isEazy Author is the perfect choice to professionalize your training content.
Applying visual thinking in the classroom does not mean knowing how to draw well, but rather using visual resources as cognitive support to facilitate understanding. Some of the most powerful elements are:

Visual thinking combines perfectly with:
Some of the applications of Visual Thinking in L&D and Human Resources include:

Ready to take your training content to the next level? isEazy Author allows you to implement visual thinking in your training projects quickly, professionally, and without the need for advanced technical knowledge.
With its new AI Autopilot, you can start creating e-learning courses automatically from an idea or from your own corporate documentation. And all of this while maintaining control over the final result and pedagogical quality.
Request a demo and discover how isEazy Author can help you create visual learning experiences that generate real impact.
Yes, and it is one of the most common applications of visual thinking. Visual thinking fits perfectly into e-learning training, as it allows information to be structured clearly and reduces the cognitive load on the learner.
Through visual diagrams, interactive infographics, concept maps, or process diagrams, it is possible to transform complex content into learning experiences that are more understandable, dynamic, and geared toward practical application in the workplace.
Yes. Although visual thinking is often associated with visual learning styles, in practice it benefits all types of learners and professionals. By combining images, keywords, structures, and spatial relationships, different areas of the brain are activated, facilitating understanding and retention of information.
This approach is particularly effective in business environments, where very diverse profiles coexist, as it helps to unify the way complex ideas, processes, and concepts are communicated.
Visual thinking does not require artistic skills or prior training in design. With regular practice for two or three weeks, most people can begin to create clear and useful visual representations for their daily work.
The key is consistency and applying this methodology to real-life situations, such as explaining processes, planning projects, or creating training content. With continued use, the quality and clarity of visual diagrams naturally improve.
Not necessarily. Visual thinking can be applied perfectly well with paper and pencil, whiteboards, or sticky notes, especially in individual work sessions or face-to-face group dynamics.
However, digital tools offer significant advantages in professional environments, such as the ability to easily edit, collaborate with other teams, reuse content, and distribute it in digital formats, making them a particularly useful option for corporate training and e-learning.
Visual thinking focuses on organizing, structuring, and communicating ideas clearly, while graphic design focuses on aesthetics, visual identity, and the visual impact of a piece.
In visual thinking, the goal is not to create perfect designs, but to make information easier and faster to understand. Both disciplines can complement each other, but they have different purposes and respond to different needs.
WEBINAR
Discover The Hidden Cost of E-Learning: How AI Is Redefining ROI in Content Creation.
Thursday, May 28th | 12:00 EDT


Every learning type requires a unique solution...
With isEazy, discover the e-learning tools that adapt to all needs


Every learning type requires a unique solution...
With isEazy, discover the e-learning tools that adapt to all needs