CASE STUDY
How Clarel trained professionals at +1,000 points of sale with mobile learning

Brain
The first AI trained to teach

Author
The #1 AI-powered authoring tool on the market

Factory
Custom e-learning content factory

Skills
Comprehensive power skills course catalog

LMS
All-in-one LMS platform with AI

Engage
App for managing frontline teams
Product

What is Brain?
Everything you need to know about the first AI trained to teach.

Learning agent: CompanionNew
Supports learners and answers their questions right inside the course, without breaking the audit trail.

How does it work?
Adaptive, conversational, and contextual. That’s learning with Brain.
FEATURES

AINew
Unlock your full potential and speed up course creation with artificial intelligence.

Accessibility
Automatically meet accessibility guidelines—without sacrificing interactivity!

Interactivity
Boost engagement with interactive, ready-to-use activities that make learning fun.

Course Creation
Reduce the time it takes to create your e-learning courses with our authoring tool.

Distribution
We offer you different distribution options, so that nothing can stop you.

SCORM
Publish your course in SCORM format and share it on any LMS.
SERVICES

Instrucional Design
Surprise your students with multimedia and interactive content.

Custom Courses
We create e-learning courses for you—tailored to your needs and hassle-free!

Virtual Reality
Turn learning into an immersive experience.

Custom Avatars
Give your courses and videos a unique touch with personalized avatars.

Audiovisual FactoryNew
Turn training into something dynamic and visual with engaging videos.
CATALOG

Course catalog
Over 600 skills and competency courses to help you adapt to your team's needs.
Microsoft Copilot AcademyNew
Your professionals will learn how to apply Copilot AI to key processes within your organization.

Artificial Intelligence Academy
Train your teams in the practical use of AI to boost productivity and innovation in your company.

Cybersecurity Academy
Capacita a tu empresa con el catálogo más completo en seguridad digital corporativa.

Use cases
Choose the solution that best fits your needs

Industries
Solutions for all types of industries
USE CASES

Onboarding
Facilitate the onboarding process, productivity and engagement of your new employees.

Upskilling
Boost your team's skills and prepare them for the challenges of the future with upskilling.

Microlearning
Discover all the advantages of microlearning and boost your training results.

Gamification
Enjoy addictive training that will get your professionals hooked.

Internal Communication
Improve communication in your company and enjoy an aligned and committed team.

Mobile learning
Agile, flexible, and interactive learning—built for today’s digital-first workforce.
INDUSTRIES

Banking and financial services
Training in compliance, cybersecurity, customer service, and key skills development.

Pharmaceuticals and healthcare
Digital onboarding, regulatory updates, and ongoing training for healthcare staff.

Retail and consumer
Agile and scalable training for in-store, operational, and customer service teams.

Industry and manufacturing
Training in processes, safety, and corporate culture for distributed teams.

Education and training
Digital solutions for training centers, internal academies, and corporate universities.

Technology and telecommunications
Development of technical talent, digital skills, and upskilling and reskilling programs.
CLIENTS

MAPFRE
How MAPFRE turn e-learning into sales with isEazy

Pepco
A personalised learning experience for a growing team.

BBVA
Digitisation and creation of high quality e-learning content.

Shiseido
We increase the engagement of the training with a social and gamified app.

Telefónica
Large-scale reskilling for the company's digital transformation.

Vodafone
A personalised learning experience for a growing team.
More than 1,000 companies already rely on isEazy.


MEET ISEAZY

Events
Discover our upcoming events and connect with the future of e-learning.

News
Find out the latest news about isEazy: press releases, partnerships, updates...

Contact
Leave us your personal details and we will contact you as soon as possible.
About isEazyNew
Find out more about our company.

Careers
We are looking for the best talent, join our team!

Partners
Become our partner and grow your business.
INTERESTING RESOURCES

Blog
The best content on e-learning: trends, tools and key strategies.

Whitepapers
Gain valuable insights and stay ahead of industry trends.

Product releases
The latest news and releases of our e-learning products and solutions.

Glossary
Definitions of the most commonly used terms and key industry concepts.

Guides
Discover the best step-by-step tips and tricks to optimize your L&D strategy.

Webinars
Video sessions on our products, trends and more

Comparatives
Compare e-learning solutions available on the market and choose the most suitable one.


WEBINAR
Master AI in isEazy Author in under an hour.




GUIDE
Prepare your organization to comply with the new AI regulations

Stay up to date with all our latest news
 Subscribe to our newsletter
Stay up to date with all our latest news

October 21, 2026

CONTENT CREATED BY:

Table of contents
The Kirkpatrick model is a framework for evaluating the effectiveness of training across four successive planes: participants’ reaction, the learning they acquired, the behavior they then show on the job and the results all of that produces for the business. Donald Kirkpatrick formulated it in 1959 and, more than sixty years later, it remains the most widely used evaluation framework in corporate training.
Its real usefulness is more modest and more valuable than it’s usually made out to be: it isn’t a formula for calculating the return on training, it’s an inventory of what can be measured and of when it can be measured. And its biggest contribution is almost a rebuke: it exposes the training departments that measure only level 1 and conclude from there that the program worked.
In this guide you’ll see where the model comes from, the four levels with details on what each one costs to measure, what the research says about its weak point —it has one, and it matters— what the 2016 revision changed, and how to apply it without ending up with a report nobody uses. If what you’re after is an overview of every evaluation model available and which one to choose, you’ll find it in our guide to training evaluation.
Knowing the origin isn’t trivia: it explains why the model has the shape it has and why it carries the problem it carries.
Donald Kirkpatrick published a series of four articles in 1959 —Techniques for Evaluating Training Programs— in the Journal of the American Society of Training Directors, the magazine of the organization that is now ATD. Each article developed one of the four planes. Three and a half decades later he collected and formalized them in the book Evaluating Training Programs: The Four Levels (1994), which is the reference usually cited.
There are two details that are almost never mentioned and that are worth keeping in mind:
What matters in practice is that the model was born as a descriptive taxonomy —a way of ordering what can be observed after training— and has been used for decades as though it were an explanatory model that predicts how one thing leads to another. They aren’t the same, and that’s where the criticism you’ll see below comes from.
Each level answers a different question and is measured at a different moment. Here’s the overview before going into detail.
| Level | Question it answers | When it is measured |
|---|---|---|
| 1. Reaction | What did participants think of the program? | Right at the end, while it is fresh |
| 2. Learning | What knowledge, skills or attitudes did they acquire? | Before and after the program |
| 3. Behavior | Are they applying it on the job? | Between 30 and 90 days later |
| 4. Results | Did the business indicator it was aimed at actually move? | A quarter or more later |
It measures participants’ perception: whether they found the content relevant, whether the format worked for them, whether they would do it again. It is collected with a short survey at the close.
How it is measured: satisfaction survey, perceived-relevance score or a training NPS.
What it costs: almost nothing. It’s the only level that can be fully automated.
The typical mistake: treating it as proof of effectiveness. A high score indicates that the experience was pleasant and that the program has permission to keep existing. It does not indicate that anyone learned. The 2016 revision refined this level by adding two questions more useful than “did you like it?”: whether the participant perceives the content as relevant to their job and whether they were genuinely engaged during the training.
It measures what was actually acquired: knowledge, skills and, where applicable, changes in attitude. The rigorous way to do it is to compare a prior measurement with a later one, because without the first you can’t know how much of what someone answers correctly they already knew before walking in.
How it is measured: a before-and-after test, practical exercises, case resolution or a demonstration of the skill.
What it costs: moderate. The effort isn’t in running the test, it’s in designing it well.
The typical mistake: measuring recall only. A multiple-choice question checks recognition; asking someone to reconstruct the procedure or resolve a case checks understanding. The difference shows up precisely when it has to be applied. This is where formative assessment contributes most, because it lets you correct the gaps while the program is still running instead of discovering them at the end.
It measures whether what was learned is being applied on the job. It’s the level that genuinely matters, because it’s where you find out whether the training was good for anything, and it’s also where most implementations of the model fail.
How it is measured: on-the-job observation, work review, the direct manager’s assessment, cross-checked self-assessment or operational process indicators.
What it costs: high, and not because of the instrument but because of the organization. It requires having defined the expected behavior in observable terms, having someone observe it, and that someone knowing what to look for.
The typical mistake: trying to measure it without first defining what you expect to see. “Applying the protocol” isn’t observable; “logging the incident with the right code within the first two minutes” is. Evaluation rubrics are the tool that makes this level reproducible, because they set explicit criteria that two different observers score the same way.
And one nuance the 2016 revision put front and center: behavior doesn’t hold up on training alone. If, back on the job, nobody reinforces it, nobody reviews it and nothing changes in the environment, the behavior reverts within weeks. That isn’t a failure of the learner or of the course: it’s a failure of the system around the course.
It measures the impact on the business indicator the program was aimed at: operational errors, process times, sales, quality, turnover, accident rates.
How it is measured: by comparing how the KPI evolves, ideally against a comparison group that didn’t go through the program.
What it costs: high, and the problem isn’t collecting the data, it’s attributing it. A lot happens at once in a company, and an indicator that improves after a training program hasn’t necessarily improved because of that program.
The typical mistake: deciding which indicator to look at once the program is already over. If the KPI wasn’t named before you started, level 4 turns into a hunt for figures that confirm what you already wanted to conclude.
| Level | Measurement effort | What it lets you claim |
|---|---|---|
| 1. Reaction | Very low: an automatable survey | That the experience wasn’t an obstacle. Nothing more |
| 2. Learning | Medium: designing a before-and-after test | That there was real acquisition, not just exposure to the content |
| 3. Behavior | High: requires a trained observer and defined criteria | That the training changed what people do. It’s the claim that genuinely matters |
| 4. Results | High: requires a KPI defined in advance and, if possible, a comparison group | That the business improved, with the caveat that attributing the cause is hard |
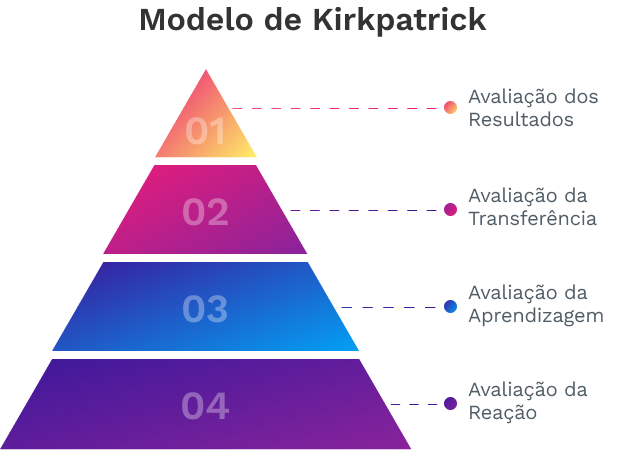
This is the part that separates those who have used the model from those who have only read about it. The usual reading is that the four levels form a chain: if people are satisfied they’ll learn, if they learn they’ll change their behavior, and if their behavior changes the business will improve. It sounds reasonable. The research doesn’t back it up.
Does this mean it should be discarded? No, and nobody serious proposes that. It means using it for what it’s good for: as an ordered list of what can be observed. What you can’t do is infer upward. A level 1 of 9 out of 10 doesn’t authorize you to take anything for granted; an excellent average score at level 2 doesn’t let you claim that anyone has changed how they work. If you want to know what’s happening at level 3, you have to go and look at level 3.
Put another way: the model tells you where to look. It doesn’t spare you from having to look.
The answer to those criticisms came from inside the family itself. In 2016, James D. Kirkpatrick and Wendy Kayser Kirkpatrick published the revision known as the New World Kirkpatrick Model, which doesn’t change the four levels but does change two decisive things: what gets measured within each one and in what order the model is used.
The change in order is the most important and the easiest to overlook. In the classic version the model is used at the end, evaluating from the bottom up. In the revision it is used at the start, designing from the top down: first you define the business result you’re after, then which behaviors would produce it, then what people need to know to perform those behaviors and, finally, what the learning experience has to look like. It’s the difference between using the model to write a report and using it to design the program.
| Level | What the 2016 version adds | What it is for |
|---|---|---|
| 1. Reaction | Perceived relevance and engagement, on top of satisfaction | It separates "I liked it" from "this is useful for my job", which predicts considerably better |
| 2. Learning | Confidence and commitment, alongside knowledge and skill | Knowing how to do something and daring to do it aren’t the same: the second part explains a lot of non-transfer |
| 3. Behavior | Required drivers: processes and systems that reinforce, monitor and reward the behavior | Job aids, coaching, work review and recognition. Without them the behavior reverts |
| 4. Results | Leading indicators: intermediate indicators observable before the final outcome | They let you correct course without waiting a quarter for the final KPI to be measurable |
The sequence that works is the one from the 2016 version: start at the end. These are the five steps, with what has to be settled in each before moving on to the next.
Before designing anything, write down the specific indicator that should move and its current value. Not “improve customer service”, but “reduce complaints escalated to second level, currently at 18%”. If you can’t name it, level 4 won’t be measurable later, however hard you try.
What people would have to do differently for that indicator to move, described so that two different people can observe the same thing and agree. This is the step that gets skipped most and the one that most determines whether level 3 will be measurable.
Two questions, not one. What knowledge and skills are needed to perform those behaviors —that’s the training content— and what has to change in the environment for them to stick: who reviews, who supports, what gets recognized. Those are the required drivers, and without them the program evaporates within a month.
Which instrument, who applies it and on what date, for each level. Level 3 included — the one that never gets planned and therefore never gets measured. If at this point there is no name and no date for the on-the-job observation, that level isn’t going to exist.
Collect each level at its own moment and, above all, don’t infer from one to another. Interpret each for what it is and cross-reference the results to locate where the chain breaks. If level 2 is high and level 3 is low, the problem is in the work environment, not in the course. If level 3 is high and level 4 doesn’t move, the behavior you chose wasn’t the one that moved the indicator. That diagnostic capability is the model’s real usefulness, and it only appears if you measure more than one level.
Measuring all four levels on every program is the fastest way to measure none of them well. The practical rule: go up to the level you can support with evidence and stop at the first one that doesn’t give you a decision. This table resolves most cases.
| Type of program | How far to go | Why |
|---|---|---|
| Onboarding | Levels 1 and 2, with level 3 for critical roles | What’s at stake is coverage and understanding; behavior is observed naturally during the probation period |
| Compliance and mandatory training | Levels 1 and 2, with traceability | The requirement is proving people were trained and understood. Level 3 only if there is real operational risk |
| Management skills | Up to level 3, without exception | A high score in leadership means nothing: the competence only exists if it is observed in how someone leads |
| Sales training | Up to level 4 | It’s the case with the most isolable and most immediate KPI: conversion, average ticket, close rate |
| Technical product training | Up to level 3, with level 4 if there is an error indicator | The behavior is directly observable and there is usually an associated quality indicator |
| Open self-service course catalog | Levels 1 and 2 | With no shared business objective there is no possible level 4: measuring level 3 here is spending without getting a decision |
A retail chain finds that 18% of complaints get escalated to second level when they could be resolved in store. Here’s how the full model would be applied, in the right order:
Notice what was designed first and what was designed last. The course is the final piece, not the first.
A real case of a level 4 that did move. Clarel aligned more than 1,000 points of sale and over 3,000 employees on culture and operations almost in real time. The published figures let you see two different levels at once: 84% participation in the training —which is coverage, not impact— and a 90% increase in product accuracy rates, which is a business indicator that did move. The distinction between those two figures is exactly what this article is about. See the case study →
CASE STUDY
How Clarel trained professionals at +1,000 points of sale with mobile learning


Almost all implementation problems repeat themselves, and almost all of them can be anticipated.
It isn’t the only framework available, and knowing the others helps you place its limits. The Phillips ROI model extends it with a fifth level that converts the benefits of level 4 into monetary value and compares that with the cost of the program. Kaufman’s adds a prior level of inputs and processes and widens the results level to impact on the customer and on society. And there are several more —CIRO, Anderson, Brinkerhoff, CIPP— with different approaches depending on what you want to find out.
As a starting point, Kirkpatrick remains the sensible choice for almost any organization: it’s the best known, the cheapest to implement at its first levels, and the one that works best as a common vocabulary between L&D and management. If you want the full comparison of the seven main models, with their level of complexity and which type of organization each one suits, it’s laid out in our guide to training evaluation. And if your context is online training, here’s how it plays out in e-learning assessment.
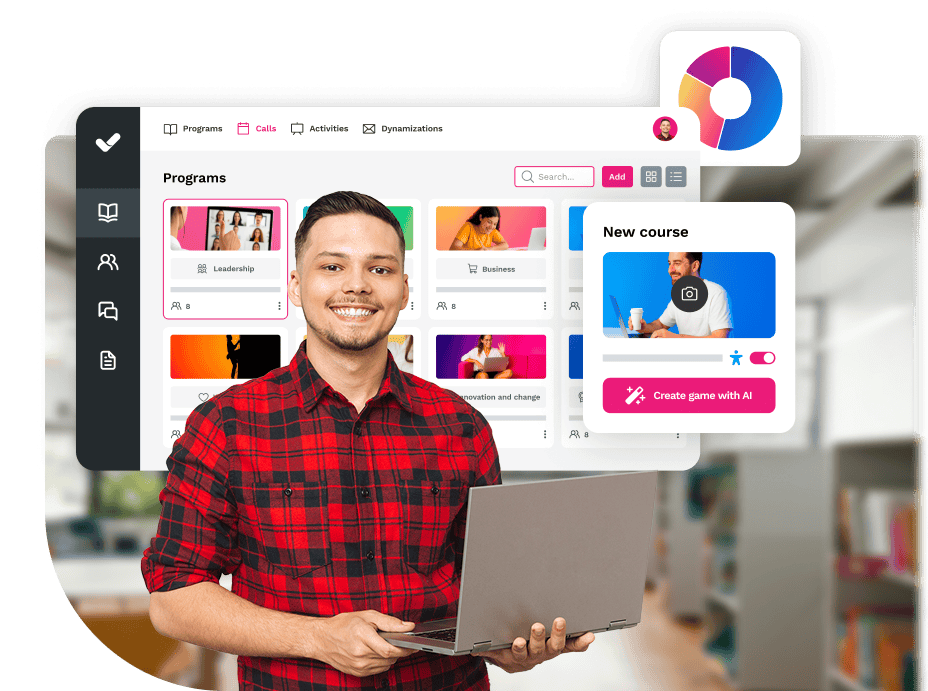
A platform doesn’t evaluate for you, but it does determine how much manual work each level takes. With isEazy LMS you can automate the part that is automatable:
And it’s worth saying plainly what no platform solves: level 3 requires observation on the job. The LMS tells you who completed what, with what score and in how long, and that’s essential; but whether someone applies what they learned with a customer in front of them is something a person has to look at. Any tool promising to solve level 3 without observation is measuring something else.
If you want to see how all of that is collected and cross-referenced in practice, you can request an isEazy LMS demo.
It’s the most widespread training evaluation framework in the corporate world. Donald Kirkpatrick formulated it in a series of four articles published in 1959, and it proposes looking at the outcome of a training program across four planes: participants’ reaction, the learning acquired, the behavior on the job and the business results. It serves one very specific purpose: keeping evaluation from stopping at “did they like it?”, which is where most of it stops. It’s best understood as an inventory of what can be measured and not as an automatic staircase, because one level does not guarantee the next. One curiosity: Kirkpatrick himself never called them “levels”, he called them steps.
Level 1, Reaction: what participants thought of the program, measured with a survey at the close. Level 2, Learning: what knowledge, skills or attitudes they acquired, measured by comparing a test before with one after. Level 3, Behavior: whether they are applying it on the job, measured through observation, work review or the manager’s assessment between 30 and 90 days later. Level 4, Results: whether the business indicator the program was aimed at has moved —errors, times, sales, turnover. The practical difference between the four is cost: level 1 is measured in minutes, while level 3 requires someone to observe the workplace and is where most implementations fail.
No, and it’s the model’s most expensive misunderstanding. The idea that satisfaction leads to learning, learning to behavior change and that to results is known as the causal hypothesis, and the research doesn’t back it. Alliger and Janak (1989), in Personnel Psychology, reviewed it thirty years after it was formulated and found very limited empirical support: reaction does not predict learning. Alliger and colleagues (1997) confirmed it in a meta-analysis, with no substantial correlations between levels. And Holton (1996) argued that it is in fact a taxonomy of outcomes and not an evaluation model, because it leaves out the variables that genuinely explain transfer: motivation, the work environment and the manager’s support. The practical consequence: an excellent level 1 doesn’t authorize you to take anything for granted.
It’s the revision James and Wendy Kirkpatrick published in 2016, and it answers precisely those earlier criticisms. It adds two pieces. At level 3, the required drivers: the processes and systems that reinforce, monitor and reward the behavior on the job —job aids, coaching, work review, recognition— because without them the behavior doesn’t hold up, however much training there is. At level 4, the leading indicators: intermediate indicators that let you see whether you’re heading in the right direction before the final result is measurable. And it changes the method: instead of evaluating upward at the end, you design backward from the business result. It’s the difference between using the model to write a report and using it to design the program.
It depends on the program, and measuring all four levels on everything is the fastest way to measure none of them well. The practical rule: go up to the level you can answer with evidence and stop at the first one that doesn’t give you a decision. In onboarding and compliance training, levels 1 and 2 usually suffice, because what’s at stake is coverage and understanding. In management skills and sales training, level 3 is essential: if it isn’t applied, the program wasn’t good for anything, however good the score. And reserve level 4 for the programs with the biggest investment or the ones aimed at a specific, isolable KPI. A useful decision criterion: if you can’t name the business indicator before launching the program, you won’t be able to measure level 4 afterward.
With three conditions, and if one is missing it can’t be done. The first is having defined the observable behavior before training: not “apply the service protocol”, but “identify the real reason for the complaint within the first two minutes and log it in the system with the right code”. The second is who observes: the direct manager, through work review, shadowing or a shared rubric — and for that you have to train the observer, not just the learner. The third is when: between 30 and 90 days later, because any earlier you’re measuring recall and not habit. Evaluation rubrics are the tool that makes this level reproducible, because they turn “they do it well” into explicit criteria that two different observers score the same way.

GUIDE
Prepare your organization to comply with the new AI Regulations
Download guide


Streamline your training management
Experience the power of AI in an LMS that has it all


Streamline your training management
Experience the power of AI in an LMS that has it all