Author
The #1 AI-powered authoring tool on the market

Factory
Custom e-learning content factory

Skills
Comprehensive power skills course catalog

LMS
All-in-one LMS platform with AI

Engage
App for managing frontline teams

Game
Gamification app for business
FEATURES

AINew
Unlock your full potential and speed up course creation with artificial intelligence.
Accessibility
Automatically meet accessibility guidelines—without sacrificing interactivity!

Interactivity
Boost engagement with interactive, ready-to-use activities that make learning fun.

Course Creation
Reduce the time it takes to create your e-learning courses with our authoring tool.

Distribution
We offer you different distribution options, so that nothing can stop you.

SCORM
Publish your course in SCORM format and share it on any LMS.


SERVICES

Instrucional Design
Surprise your students with multimedia and interactive content.

Custom Courses
We create e-learning courses for you—tailored to your needs and hassle-free!

Virtual Reality
Turn learning into an immersive experience.

Custom Avatars
Give your courses and videos a unique touch with personalized avatars.

Audiovisual FactoryNew
Turn training into something dynamic and visual with engaging videos.
CATALOG
Course catalog
Over 600 skills and competency courses to help you adapt to your team's needs.

Microsoft Copilot AcademyNew
Your professionals will learn how to apply Copilot AI to key processes within your organization.
Artificial Intelligence Academy
Train your teams in the practical use of AI to boost productivity and innovation in your company.

Cybersecurity Academy
Capacita a tu empresa con el catálogo más completo en seguridad digital corporativa.
FEATURES

Quizzes & Games
Turn your training into an engaging Q&A game.

Challenges & Competitions
Enhance learning through friendly peer challenges.
Rewards & Incentives
Motivate employees with points, levels, and leaderboards.
Social & Collaborative
Strengthen team connections with interactive social dynamics.

KPIs & Analytics
Track and optimize your training initiatives instantly and effortlessly.


Use cases
Choose the solution that best fits your needs

Industries
Solutions for all types of industries
USE CASES
Onboarding
Facilitate the onboarding process, productivity and engagement of your new employees.
Upskilling
Boost your team's skills and prepare them for the challenges of the future with upskilling.
Microlearning
Discover all the advantages of microlearning and boost your training results.
Gamification
Enjoy addictive training that will get your professionals hooked.

Internal Communication
Improve communication in your company and enjoy an aligned and committed team.

Mobile learning
Agile, flexible, and interactive learning—built for today’s digital-first workforce.
INDUSTRIES

Banking and financial services
Training in compliance, cybersecurity, customer service, and key skills development.

Pharmaceuticals and healthcare
Digital onboarding, regulatory updates, and ongoing training for healthcare staff.

Retail and consumer
Agile and scalable training for in-store, operational, and customer service teams.

Industry and manufacturing
Training in processes, safety, and corporate culture for distributed teams.

Education and training
Digital solutions for training centers, internal academies, and corporate universities.

Technology and telecommunications
Development of technical talent, digital skills, and upskilling and reskilling programs.
CLIENTS

MAPFRE
How MAPFRE turn e-learning into sales with isEazy

Pepco
A personalised learning experience for a growing team.

BBVA
Digitisation and creation of high quality e-learning content.

Shiseido
We increase the engagement of the training with a social and gamified app.

Telefónica
Large-scale reskilling for the company's digital transformation.
Vodafone
A personalised learning experience for a growing team.
More than 1,000 companies already rely on isEazy.


MEET ISEAZY

News
Find out the latest news about isEazy: press releases, partnerships, updates...

Contact
Leave us your personal details and we will contact you as soon as possible.
About isEazyNew
Find out more about our company.
Careers
We are looking for the best talent, join our team!

Partners
Become our partner and grow your business.
INTERESTING RESOURCES

Blog
The best content on e-learning: trends, tools and key strategies.
Whitepapers
Gain valuable insights and stay ahead of industry trends.
Product releases
The latest news and releases of our e-learning products and solutions.

Glossary
Definitions of the most commonly used terms and key industry concepts.
Guides
Discover the best step-by-step tips and tricks to optimize your L&D strategy.
Webinars
Video sessions on our products, trends and more

Comparatives
Compare e-learning solutions available on the market and choose the most suitable one.

STUDY
Download the free study, developed in collaboration with Microsoft, and discover the insights.
Stay up to date with all our latest news
 Subscribe to our newsletter
 Stay up to date with all our latest news

January 28, 2026
How to create a course satisfaction survey and the best tools
CONTENT CREATED BY:

Table of contents
Measuring satisfaction is essential for improving experiences, services, products, and processes within any organization. From customer experience to employee experience, satisfaction surveys make it possible to gather valuable information to make data-driven decisions. In training contexts, for example, they help refine e-learning experiences and outcomes.
By understanding what works and what doesn’t, companies can create engaging and effective learning experiences that lead to higher retention rates and improved overall performance.
What is a satisfaction survey?
A satisfaction survey is a questionnaire designed to evaluate a person’s perception of an experience, service, product, or process. They are used in areas such as customer service, employee experience, events, technical support, and corporate training.
Course satisfaction surveys are likewise structured questionnaires designed to assess learners’ experiences with a specific course. Their main purpose is to determine the effectiveness of the material, the teaching methods used, and the organization of the course.
Why send satisfaction surveys at the end of a course?
Sending a satisfaction survey is one of the most effective ways to measure the perceived quality of a training program and identify opportunities for improvement based on real data. It’s not just about “asking what they thought,” but about obtaining actionable information to make decisions regarding course design, methodology, and impact.
In addition, a well-designed survey makes it possible to:
- Identify which parts of the course provide the most value (and which do not).
- Detect friction points that affect the learner experience (structure, pace, clarity, etc.).
- Measure the level of satisfaction and its relationship with engagement, retention, and on-the-job application.
- Gain insights to improve future editions and keep training aligned with business needs.
- Reinforce the perception of quality and continuous improvement, showing that the organization listens and evolves.
In corporate training, this type of feedback is especially valuable because it helps ensure that programs are not only consumed, but truly work and generate results.
The role of satisfaction surveys in course improvement
Satisfaction surveys serve as a crucial tool for identifying strengths and weaknesses in your e-learning courses. By assessing learners’ perceptions, organizations can implement specific changes that enhance course content, teaching methodology, and overall effectiveness.
High levels of learner satisfaction are correlated with improved engagement and retention. Satisfied learners are more likely to complete courses, apply their knowledge, and recommend the program within their organizations. Additionally, a robust feedback system enhances institutional reputation, demonstrating a commitment to excellence and continuous improvement in corporate training.
Key feedback areas in a satisfaction survey
Typical focus areas include:
- Content quality: relevance, depth, and applicability of the course material.
- Teaching effectiveness: instructor engagement, clarity, and responsiveness.
- Materials: quality and accessibility of supporting resources.
- Organization: logical progression, structural clarity, and course pacing.
By focusing on these areas, organizations can generate actionable insights to refine their training programs.

When and how often to launch satisfaction surveys
Not all satisfaction surveys serve the same purpose. The frequency with which you launch them directly influences the quality of the feedback you obtain and, above all, your ability to improve the learning experience while the course is still in progress. For this reason, before designing questions, it is important to define at what moments it makes the most sense to request feedback and what type of survey you need in each case.
End-of-course surveys vs. periodic surveys
End-of-course surveys are a common practice where feedback is collected upon course completion. These surveys provide immediate insights but may miss the learning nuances experienced throughout the duration of the course. Periodic surveys, on the other hand, collect feedback at regular intervals, allowing for continuous adjustments and improvements throughout the learning journey.
Recommendation: for long-duration courses (more than 4 weeks), combine mid-course surveys with a comprehensive final survey. Continuous satisfaction monitoring creates a feedback loop that keeps the course offering agile and responsive to learner needs. Regularly engaging with learners helps identify issues before they escalate, maintaining high levels of satisfaction and retention.

How to create a satisfaction survey: 7 key steps
A satisfaction survey is not just about collecting opinions: it’s about asking the right questions to obtain useful insights. If the questionnaire is poorly focused, you may end up with overly generic results (“I liked it / I didn’t like it”) that are not useful for improving the course. Instead, by following a clear process, you will obtain actionable data to optimize content, methodology, materials, and the learning experience.
Below, you’ll find a practical step-by-step guide to designing an effective satisfaction survey, balancing quantitative and qualitative questions, and ensuring that all feedback serves a real purpose.
Step 1: define clear objectives for your questionnaire
- Identify what you want to measure: start by clarifying the objectives of your satisfaction survey. Common goals include evaluating the impact of course content on job performance, determining instructor effectiveness, or understanding the usability of learning materials.
- Align questions with improvement goals: once objectives are set, make sure each question aligns with these goals. For example, if your objective is to improve instructor delivery, include specific questions about clarity, engagement, and responsiveness.
- Example objective: “Identify areas for improvement in instructor methodology to increase engagement by 20%”.
Step 2: choose the right types of questions
- Closed questions for quantitative insights: closed questions (those with predefined answers) allow you to collect measurable data. For example, “On a scale of 1 to 5, how would you rate the course content?” provides clear metrics for analysis.
- Open-ended questions for qualitative feedback: open-ended questions invite more detailed feedback. For example, “Which aspects of the course did you find most useful?” This allows learners to express their thoughts in their own words, providing richer context to quantitative data.
- Effective use of Likert scales and multiple-choice questions: Likert scales (a system where respondents indicate their level of agreement or disagreement with a series of statements, using options such as “Strongly disagree” to “Strongly agree”) are effective for measuring attitudes and perceptions. Multiple-choice questions help aggregate learner preferences, making data analysis easier. Both methods provide actionable insights when tailored to specific objectives.
- Recommended proportion: 70% closed questions / 30% open-ended questions.
Step 3: design a clear and logical structure
Structure your satisfaction questionnaire logically by grouping questions into thematic sections, such as:
- Content: questions about course material and its relevance.
- Instructor: evaluations of teaching methodologies.
- Materials: evaluations of supporting resources.
- Platform/Technology: usability and technical experience.
- Overall Satisfaction: general impressions and recommendations.
Keep the questionnaire concise and easy to follow, as clarity and brevity are critical. Aim for a survey length that encourages completion, ideally no more than 10–15 minutes. This respects learners’ time and reduces survey fatigue.
Ideal number of questions: 15–20 questions (12–15 closed + 3–5 open-ended).
Step 4: select an appropriate rating scale
- Overview of common scales: numeric, stars, percentages, verbal: choose a rating scale that best fits your survey objectives. Numeric scales (1–10), star ratings, and percentages can all be effective. For example, a star rating may be more intuitive for some learners, while numeric scales offer more granular measurement.
- Advantages of using the Likert scale in satisfaction surveys: the Likert scale is particularly beneficial for measuring attitudes. By providing a range of responses (strongly agree to strongly disagree), it enables more nuanced feedback that helps identify subtle differences in learner satisfaction.
Most effective scales:
- 5-point Likert scale (Very dissatisfied – Very satisfied).
- Numeric scale 1–10 for overall ratings.
- NPS (Net Promoter Score) to measure recommendation.
Step 5: avoid bias to ensure accurate results
Common biases include:
- Response bias: when respondents answer falsely or in a socially desirable way.
- Question wording bias: leading questions that suggest a particular answer.
- Sampling bias: not representing the full learner demographic.
- Acquiescence bias: tendency to agree with all statements.
- Recency bias: only remembering the most recent course experiences.
Best practices to minimize bias
To encourage honesty and accuracy, use neutral wording in survey questions, avoid double-barreled questions (asking two things at once), randomize question order to prevent priming effects, and ensure anonymity for more honest responses.
- Example of a biased question: “Don’t you think the excellent course content was useful?”
- Correct version: “How would you rate the usefulness of the course content?”
Step 6: test and refine your questionnaire before launch
- Run pilot tests with a small group: before full deployment, consider running a pilot with a small and diverse group of learners. Their feedback will help identify confusing questions, technical issues, or areas needing clarification.
- Recommended pilot group: 10–15 people representative of your audience.
Adjust questions and length based on feedback
Use insights from the pilot group to make necessary adjustments. This may involve rephrasing questions, adding clarifications, or removing redundant items, ensuring the final questionnaire is as effective as possible.
Metrics to evaluate in the pilot:
- Average completion time.
- Drop-off rate per question.
- Questions that cause confusion.
- Clarity of instructions.
Step 7: analyze results and implement improvements
Group and interpret data to obtain actionable insights: after collecting responses, analyze the data for trends and patterns. Look for common themes emerging from both qualitative and quantitative data. Grouping similar responses can make it easier to identify areas for improvement.
Analysis tools:
- NPS calculation (Net Promoter Score).
- Sentiment analysis for open-ended responses.
- Correlation matrices between variables.
- Segmentation by learner profiles.
Share findings with instructors and stakeholders
Share insights and results with course leaders, instructors, and relevant stakeholders. Involving them in the feedback process improves accountability and fosters a collaborative approach to course improvements.
Use feedback to improve course quality and learner experience
Finally, use feedback not only to improve specific courses but also to inform broader organizational training strategies. Continuous iteration based on learner feedback cultivates a culture of excellence in corporate e-learning.
Example questions for course satisfaction surveys [Free template]
A good satisfaction survey should cover the entire learning experience: from content quality to methodology, resources, and platform. For feedback to be truly useful, it’s ideal to combine closed questions (to obtain measurable data) with open-ended questions (to better understand the “why” behind each answer).
Below is a list of questions organized by sections so you can reuse them as a template and adapt them to any course.
Section 1: Course content (closed questions)
- On a scale of 1 to 5, how relevant was the course content to your professional needs?
- How would you rate the depth of the content?
- Do you think you will be able to apply what you learned in your daily work?
- Do you consider the course content to be up to date and aligned with current industry trends?
Section 2: Instructor and methodology (closed questions)
- Did the instructor explain the concepts clearly and understandably?
- How would you rate the instructor’s level of engagement and dynamism?
- Was the instructor available and did they resolve your questions in a timely manner?
- Were the teaching methodologies and techniques used effective?
Section 3: Materials and resources (closed questions)
- Were the course materials (documents, videos, presentations) of good quality?
- Did you have easy access to all course materials and resources?
- Did the variety of formats (video, text, interactive) support your learning?
Section 4: Organization and platform (closed questions)
- Was the course structure and organization logical and easy to follow?
- How would you rate the course pace?
- Was the total course duration appropriate for the content covered?
- Was the e-learning platform easy to use and navigate?
Section 5: Overall satisfaction (closed questions)
- Overall, how satisfied are you with this course?
- Did the course meet your initial expectations?
- How likely are you to recommend this course to a colleague?
Section 6: Open-ended questions (qualitative feedback)
- Which aspects of the course did you find most valuable or useful?
- Which aspects of the course do you think could be improved?
- Do you have any specific suggestions for future editions of this course?
- Is there anything else you would like to share about your course experience?
Common mistakes when designing satisfaction surveys
Designing a satisfaction survey seems simple, but it’s one of those cases where small mistakes can ruin the results. Poor question wording, overly long questionnaires, or lack of follow-up action can lead to unreliable responses and low participation. To avoid this, it’s important to understand the most common mistakes and how to correct them before launching your survey.
Mistake 1: surveys that are too long
- Problem: questionnaires with more than 30 questions cause fatigue and drop-off rates above 40%.
- Solution: limit your survey to 15–20 essential questions. Prioritize quality over quantity.
Mistake 2: questions with technical or confusing language
- Problem: using technical jargon or ambiguous wording leads to inconsistent answers.
- Solution: use simple and direct language. Test each question with someone outside the project.
Mistake 3: not including open-ended questions
- Problem: using only closed questions limits feedback depth and causes valuable insights to be lost.
- Solution: include 3–5 strategic open-ended questions to capture nuances and specific suggestions.
Mistake 4: sending the survey at the wrong time
- Problem: launching the survey immediately after the course or too late reduces response quality.
- Solution: the optimal time is usually 24–48 hours after course completion, when the experience is still fresh but learners are not overwhelmed.
Mistake 5: not acting on the results
- Problem: collecting feedback without implementing improvements creates distrust and reduces future participation.
- Solution: communicate the changes made based on the results. Close the feedback loop with learners.
Mistake 6: biased or leading questions
- Problem: questions like “Didn’t you think our course was excellent?” artificially induce positive responses.
- Solution: use neutral wording, for example: “How would you rate your overall experience with the course?”.
Mistake 7: not segmenting results
- Problem: analyzing data in aggregate hides important differences between learner profiles.
- Solution: segment by profile, department, previous experience level, or other relevant criteria.
Mistake 8: inconsistent rating scale
- Problem: mixing scales (1–5, 1–10, stars) in the same survey confuses respondents and reduces reliability.
- Solution: use a single consistent scale throughout the questionnaire, preferably a 5-point Likert scale.
Tools to create satisfaction surveys
If you want to measure the satisfaction of employees, learners, or customers, there are many tools that make it easy to create, send, and analyze surveys without technical knowledge. Here are some of the most widely used:
- Google Forms: one of the simplest and most accessible options. It allows you to quickly create surveys, use Likert-style scales, open-ended or multiple-choice questions, and visualize results in automatic charts or export them to Google Sheets for more detailed analysis.
- Microsoft Forms: integrated into the Microsoft 365 ecosystem. It’s practical for organizations already working with Teams, Outlook, or SharePoint, as it makes it easy to share surveys within the corporate environment.
- SurveyMonkey: a very popular tool, more oriented toward professional use. It offers satisfaction survey templates, conditional logic, basic segmentation, and more advanced reports than free options.
- Typeform: stands out for its user experience. Surveys are displayed in a conversational, one-question-at-a-time format, which often improves response rates. It’s useful when you want a more polished experience and less of a “traditional form” feel.
- Qualtrics: an enterprise-level platform focused on customer experience (CX) and employee experience (EX). It supports more complex studies, advanced segmentation, statistical analysis, and continuous satisfaction tracking.
- Jotform: similar to Google Forms, but with more design and customization options. It includes many templates and makes it easy to integrate forms into websites or landing pages.
When choosing a tool, it’s not only about how easy it is to create the survey, but also what you plan to do with the data afterward. If you need something quick and one-off, a basic solution may be enough. If your goal is ongoing satisfaction tracking and strategic decision-making, it’s worth choosing platforms with stronger analysis and integration capabilities.
Course satisfaction surveys: which tool is best?
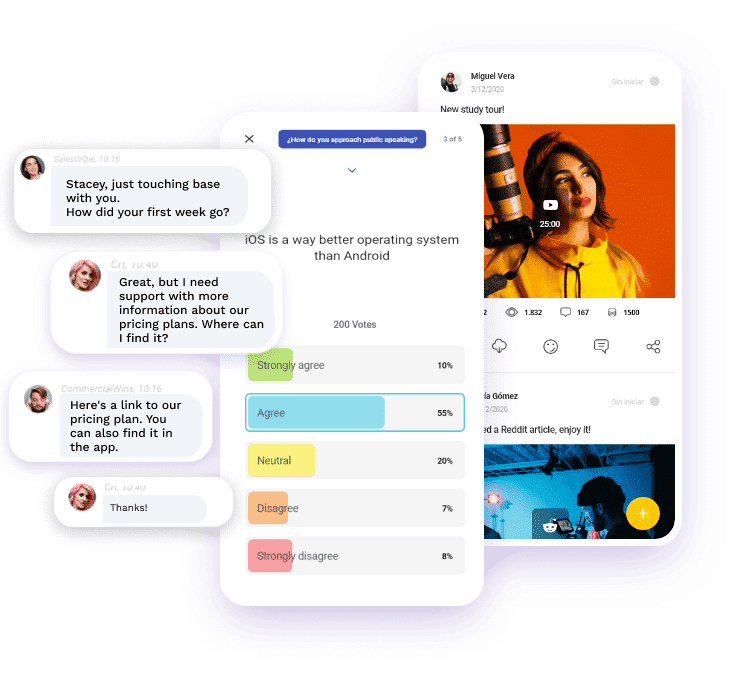
For a satisfaction survey to work, it must be easy to answer and integrated into the learner’s daily routine. This is especially important in companies with frontline teams, where time is limited, teams are dispersed, and training often happens in micro-moments (between shifts, on mobile devices, or at the point of sale).
In this context, isEazy Engage makes it possible to centralize in a single app what usually happens across different tools: team communication, agile training, and progress tracking. In addition, it integrates surveys and polls within the same environment where employees receive information and complete training, avoiding reliance on external forms or parallel channels.
The result is a much more efficient feedback system: you launch the survey in the right place, get faster responses, and connect the data with the team’s reality, without friction or dispersion.
Comparison table of tools for creating satisfaction surveys
| Tool | Highlights | Ideal for |
|---|---|---|
| isEazy Engage | Surveys integrated into the app, communication + training in one place, agile mobile participation | Frontline teams, companies with distributed teams or high turnover |
| Google Forms | Free and easy to use, integration with Google Sheets, customizable templates | Small teams or pilot projects |
| SurveyMonkey | Professional templates, advanced branching logic, integrated analytics | Organizations that need more complex surveys |
| Typeform | Highly visual interface, conversational experience, response-oriented UX | Maximizing response rates with an engaging experience |
| Microsoft Forms | Integration with Microsoft 365, real-time collaboration, reporting with Power BI | Companies already working within the Microsoft ecosystem |
Creating an effective course satisfaction survey does not mean adding random questions, but rather designing a feedback system that allows you to improve training with real data. When you define clear objectives, choose the right types of questions, and analyze results with intention, feedback stops being a formality and becomes a decision-making tool: optimizing content, adjusting methodologies, reducing dropouts, and increasing on-the-job knowledge transfer.
There is no single “perfect” tool for every case. The decision depends on the type of training, the learner profile, and the level of analysis you need. But if there is one principle that always works, it’s this: make the survey easy, integrated, and contextual, so that feedback is high quality and can be turned into real improvements.
Also, remember that participation largely depends on the learner experience. Therefore, whenever possible, launch surveys within the same environment where learning takes place, so responding is quick, natural, and frictionless.
If you want to take the next step and turn feedback into a continuous process (without relying on external tools), with isEazy Engage you can launch surveys and polls integrated into the team’s daily workflow, alongside communication and training, to collect real-time insights and continuously improve the learning experience. Want to see it in action? Request a demo of isEazy Engage.
Frequently Asked Questions (FAQs) about course satisfaction surveys
How many questions should a course satisfaction survey include?
The ideal number is between 15 and 20 questions. This allows you to gather comprehensive information without causing survey fatigue. Distribute them as follows: 12–15 closed questions (scales, multiple choice) and 3–5 open-ended questions for detailed qualitative feedback. Shorter surveys (10–12 questions) work well for brief courses, while longer programs may justify up to 25 questions.
What questions should you include in a course satisfaction survey?
Essential questions should cover these areas:
- Content: relevance, depth, up-to-date information.
- Instructor: clarity, engagement, availability.
- Materials: quality, accessibility, variety of formats.
- Organization: logical structure, pace, duration.
- Platform: usability and technical experience.
- Overall satisfaction: NPS, expectations met.
- Impact: practical applicability at work.
Include both closed questions (Likert scales) and open-ended questions to capture deeper qualitative insights.
When is the best time to send a satisfaction survey?
The optimal timing is 24–48 hours after course completion. At this point, the experience is still fresh in the learner’s memory, but they are no longer overwhelmed by the course workload. For long courses (more than 4 weeks), consider additional pulse surveys every 2–3 weeks. Avoid sending surveys immediately after completion or more than a week later, as this reduces both response quality and rates.
How should you analyze satisfaction survey results?
- Calculate key metrics: overall satisfaction average, NPS, response rates.
- Segment data: by learner profile, department, cohort.
- Identify patterns: look for trends in closed responses and recurring themes in open feedback.
- Prioritize actions: focus on low-scoring, high-impact areas.
- Benchmark comparisons: compare with previous surveys or industry standards.
- Create visual reports: use charts and dashboards to communicate findings.
- Define an action plan: set concrete improvements with owners and deadlines.
What is a good response rate for a satisfaction survey?
A response rate above 60% is considered excellent in corporate e-learning. 40–60% is good, 25–40% is acceptable but improvable, and below 25% indicates serious issues.
To improve response rates:
- Send friendly reminders 3–4 days later.
- Keep the survey short (10–15 minutes).
- Clearly explain how feedback will be used.
- Offer incentives when appropriate (certificates, recognition).
- Ensure anonymity to encourage honest responses.
Should surveys be anonymous or identified?
Anonymous surveys generally produce more honest and candid feedback, especially when evaluating instructors or sensitive aspects. Identified surveys, however, allow personalized follow-up and resolution of specific learner issues.
Recommendation: Use anonymous surveys for general course evaluations, and identified surveys only when individual follow-up is necessary or context requires it (e.g., personalized coaching programs).
Which rating scale is better: 1–5 or 1–10?
The 5-point Likert scale (1–5) is usually more effective because:
- It is easier and faster to answer.
- It reduces ambiguity in middle options.
- It generates more consistent and reliable data.
- It is the standard in most academic surveys.
The 1–10 scale can be used for very specific questions like NPS (Net Promoter Score), where additional granularity adds value. Avoid even-numbered scales (1–4, 1–6) as they force a side and eliminate the valuable neutral midpoint.
What should I do if I receive a lot of negative feedback?
Negative feedback is a valuable opportunity for improvement, not a failure. Follow these steps:
- Do not get defensive: thank learners for their honesty.
- Analyze patterns: is it an isolated or systemic issue?
- Prioritize by impact: focus on problems affecting the most learners.
- Communicate quickly: acknowledge the identified issues.
- Implement changes: act visibly on the feedback.
- Follow up: measure whether improvements solved the issues.
Remember: courses with 100% positive feedback often are not generating honest responses. 15–20% negative feedback is normal and healthy.
Featured articles


Does your learning strategy need a boost?
Discover the best e-learning solutions all in one place
Request a demoTry it free

Boost your team’s engagement and productivity
It brings together all communication, training, and task management into a single tool.


Boost your team’s engagement and productivity
It brings together all communication, training, and task management into a single tool.
Related articles