CASE STUDY
How Pepco was able to comprehensively manage employee training with an LMS

Brain
The first AI trained to teach

Author
The #1 AI-powered authoring tool on the market

Factory
Custom e-learning content factory

Skills
Comprehensive power skills course catalog

LMS
All-in-one LMS platform with AI

Engage
App for managing frontline teams
FEATURES

AINew
Unlock your full potential and speed up course creation with artificial intelligence.

Accessibility
Automatically meet accessibility guidelines—without sacrificing interactivity!

Interactivity
Boost engagement with interactive, ready-to-use activities that make learning fun.

Course Creation
Reduce the time it takes to create your e-learning courses with our authoring tool.

Distribution
We offer you different distribution options, so that nothing can stop you.

SCORM
Publish your course in SCORM format and share it on any LMS.
SERVICES

Instrucional Design
Surprise your students with multimedia and interactive content.

Custom Courses
We create e-learning courses for you—tailored to your needs and hassle-free!

Virtual Reality
Turn learning into an immersive experience.

Custom Avatars
Give your courses and videos a unique touch with personalized avatars.

Audiovisual FactoryNew
Turn training into something dynamic and visual with engaging videos.
CATALOG

Course catalog
Over 600 skills and competency courses to help you adapt to your team's needs.
Microsoft Copilot AcademyNew
Your professionals will learn how to apply Copilot AI to key processes within your organization.

Artificial Intelligence Academy
Train your teams in the practical use of AI to boost productivity and innovation in your company.

Cybersecurity Academy
Capacita a tu empresa con el catálogo más completo en seguridad digital corporativa.

Use cases
Choose the solution that best fits your needs

Industries
Solutions for all types of industries
USE CASES

Onboarding
Facilitate the onboarding process, productivity and engagement of your new employees.

Upskilling
Boost your team's skills and prepare them for the challenges of the future with upskilling.

Microlearning
Discover all the advantages of microlearning and boost your training results.

Gamification
Enjoy addictive training that will get your professionals hooked.

Internal Communication
Improve communication in your company and enjoy an aligned and committed team.

Mobile learning
Agile, flexible, and interactive learning—built for today’s digital-first workforce.
INDUSTRIES

Banking and financial services
Training in compliance, cybersecurity, customer service, and key skills development.

Pharmaceuticals and healthcare
Digital onboarding, regulatory updates, and ongoing training for healthcare staff.

Retail and consumer
Agile and scalable training for in-store, operational, and customer service teams.

Industry and manufacturing
Training in processes, safety, and corporate culture for distributed teams.

Education and training
Digital solutions for training centers, internal academies, and corporate universities.

Technology and telecommunications
Development of technical talent, digital skills, and upskilling and reskilling programs.
CLIENTS

MAPFRE
How MAPFRE turn e-learning into sales with isEazy

Pepco
A personalised learning experience for a growing team.

BBVA
Digitisation and creation of high quality e-learning content.

Shiseido
We increase the engagement of the training with a social and gamified app.

Telefónica
Large-scale reskilling for the company's digital transformation.

Vodafone
A personalised learning experience for a growing team.
More than 1,000 companies already rely on isEazy.


MEET ISEAZY

Events
Discover our upcoming events and connect with the future of e-learning.

News
Find out the latest news about isEazy: press releases, partnerships, updates...

Contact
Leave us your personal details and we will contact you as soon as possible.
About isEazyNew
Find out more about our company.

Careers
We are looking for the best talent, join our team!

Partners
Become our partner and grow your business.
INTERESTING RESOURCES

Blog
The best content on e-learning: trends, tools and key strategies.

Whitepapers
Gain valuable insights and stay ahead of industry trends.

Product releases
The latest news and releases of our e-learning products and solutions.

Glossary
Definitions of the most commonly used terms and key industry concepts.

Guides
Discover the best step-by-step tips and tricks to optimize your L&D strategy.

Webinars
Video sessions on our products, trends and more

Comparatives
Compare e-learning solutions available on the market and choose the most suitable one.



October 19, 2026

CONTENT CREATED BY:

Table of contents
The attrition rate is the percentage of people who leave an organization over a given period, whether the departure is voluntary or involuntary. It is calculated by dividing the number of departures in the period by the average headcount for that same period and multiplying the result by 100. Unlike other HR indicators, it does not just measure movement: it measures the loss of talent and knowledge.
In corporate training and people management it is one of the benchmark indicators because it connects to everything else: workplace climate, leadership, career development and engagement. For a sense of scale, the U.S. Bureau of Labor Statistics recorded 63.2 million total separations in 2024, an average of 3.3% of employment every month, although the figure varies enormously by industry.
In this guide you will see exactly what the attrition rate measures, how to calculate it without the number misleading you, what it costs you in dollars, what types exist, what factors drive it up, when it should worry you and which actions actually reduce it, with particular attention to the role of learning and career development.
The attrition rate is used mainly in human resources, although it is also applied in education, customer service and user management. In a company, its job is to give a clear view of actual workforce turnover and of the organization’s ability to retain talent.
Its value is more strategic than operational, because a single number summarizes several realities at once:
It is also worth clarifying what it is not. The attrition rate is not the churn rate: that term measures customer loss, not employee loss, and although the formula looks similar, the number answers a different business question. And on its own it is not a diagnosis either: it is the symptom that forces you to look for the cause.

One of the most common mistakes is using attrition rate and employee turnover as synonyms. They are related, but they do not measure the same thing, and confusing them leads to comparing figures that are not comparable.
| Metric | What it measures | Typical mistake when using it |
|---|---|---|
| Attrition rate | Every departure from the organization, voluntary and involuntary, whether or not the role is backfilled afterwards | Reading it as a problem when some of the departures are part of a planned restructuring |
| Employee turnover | Departures that require a replacement, meaning the full exit-and-hire cycle | Comparing it with another company's attrition without knowing whether both count roles that are never backfilled |
| Churn rate | Customer or user loss over a period, not employee loss | Importing the commercial churn formula into the people function and lumping hires and exits together |
In practice, the attrition rate helps you analyze overall talent loss and turnover is used more to assess hiring and replacement dynamics. They are complementary metrics: together they give a far more complete picture of your workforce than either one on its own.
Calculating the attrition rate is simple, but doing it properly is what separates an actionable figure from a number that helps you decide nothing.
The most common formula is this:
(Number of departures during the period / Average number of employees during the period) × 100
For example, if a company records 12 departures over a year and has an average of 120 employees in that same period, the calculation would be:
12 ÷ 120 = 0.1
0.1 × 100 = 10% annual attrition rate
The attrition rate can be calculated:
If you need to get ahead of the problem without waiting for year-end, annualize the monthly figure by multiplying it by 12. A company with 1.5% departures in March is on track for 18% a year if the pace holds. It is a projection, not a certainty, but it lets you react in March instead of December. What matters is always keeping the same criteria when comparing periods or departments.
For the figure to be useful:
The argument that moves a retention budget is not the percentage: it is the dollar. According to Gallup, the cost of replacing one person ranges from one-half to two times their annual salary, depending on the role and how hard it is to fill. With that range you can already put a figure on your own data.
The formula to estimate it is:
Annual cost of attrition = No. of departures per year × Average annual salary × Replacement factor (0.5 to 2)
Following the earlier example, a company with 120 employees, 12 departures a year and an average salary of $60,000, using a conservative factor of 0.75, would face an approximate cost of $540,000 a year. With a factor of 1.5 for hard-to-fill technical profiles, the figure rises to $1,080,000. Bringing the rate down from 10% to 7% in that scenario saves between $162,000 and $324,000 a year.
Use the low end of the range for operational roles that are widely available in the market, and the high end for technical positions, salespeople with an account book or middle managers. These are the components you need to add up to fine-tune your own factor:
| Cost component | What it includes | Where to find the data in your company |
|---|---|---|
| Sourcing cost | Job postings, recruiting hours, agency fees and technical assessments | Talent acquisition budget divided by the year's hires |
| Onboarding cost | Onboarding, initial training, licenses, equipment and the hours of the team supporting the new hire | Hours logged in the onboarding plan plus the cost of standard equipment |
| Productivity ramp | The months until the person performs at the level expected for the role | Average time to target in the first-year performance review |
| Knowledge loss | Undocumented know-how, client relationships and accumulated judgment | Hard to quantify: estimated as months of salary for the critical role |
| Impact on the team | Extra load on those who stay, overtime and the risk of chain departures | Overtime and absenteeism in that function in the three months after the departure |
Not all departures have the same impact or the same meaning. Distinguishing between types is what turns the figure into a decision.
This happens when the person decides to leave the company on their own initiative. It is usually related to:
It is one of the clearest signals of engagement problems.
This includes layoffs, contract endings and restructuring. It does not always indicate a problem, but it is worth analyzing alongside the organizational context so you do not mistake a business decision for a talent drain.
This occurs when the people leaving are low performers or hold roles that are no longer needed. In some cases it can even be positive.
This refers to the departure of key or high-performing employees. It is the most critical, because it directly affects productivity, knowledge and business results.
The practical rule: 12% attrition made up almost entirely of functional departures is healthier than 7% concentrated in high performers. Before launching a retention plan, cross-reference your list of departures with the latest performance review. If the people leaving are the ones who were rated highest, you have a dysfunctional attrition problem and the plan should focus on them, not on the whole workforce.
The causes repeat across industries and company sizes. These five account for most avoidable departures:
| Factor | How it affects attrition | Warning sign for HR |
|---|---|---|
| Work environment and climate | A negative or non-inclusive environment accelerates voluntary departures | Recurring complaints, unresolved conflicts, low engagement |
| Pay and benefits | The perception of unfair compensation pushes people to look elsewhere | Constant salary comparisons, external offers |
| Development opportunities | Lack of career growth is one of the leading causes of attrition | Stagnation, low participation in training |
| Leadership and management | Poor leadership erodes motivation and commitment | High turnover in specific teams or under the same manager |
| Work-life balance | Overload and lack of flexibility increase burnout | Absenteeism, burnout, requests to transfer or leave |
The warning signs in the table above are qualitative, which is why they are spotted late. Each one has a measurable equivalent that is probably already in your systems:
| Factor | Data you already have | What should make you look twice |
|---|---|---|
| Workplace climate | eNPS or climate survey by function | A function with an eNPS below the company average two quarters in a row |
| Compensation | Where each salary band sits against the market | Roles below the 50th market percentile with more than two departures a year |
| Development | Training participation and completion in the LMS | Profiles with no training activity in the last six months |
| Leadership | Attrition rate broken down by manager | A manager whose rate is double their department average |
| Workload and balance | Overtime, absenteeism and unused vacation | Teams with sustained overtime for more than a quarter |
There is a detail most HR dashboards hide: attrition is not spread evenly across the employee lifecycle. According to Work Institute’s annual exit interview analysis reported by SHRM, first-year turnover accounts for around 40% of all turnover. In other words: four out of every ten people you lose leave before their twelve-month mark.
That changes where you need to invest. If your attrition is concentrated in the first few months, the problem is rarely the three-year career path: it is in selection, in the expectations created during the hiring process, or in an onboarding that leaves the person on their own by week three. Before redesigning your compensation policy, calculate your first-90-day attrition rate and your first-12-month rate separately.
For that part of the problem, what works is measuring onboarding the way you would measure any other process: onboarding metrics tell you whether your welcome is working, and a well-structured onboarding plan reduces precisely the departures that happen before a person has had the chance to perform.
A high attrition rate has direct and indirect consequences, and the indirect ones are usually bigger.
Replacing a person means recruiting, onboarding and training costs, plus the time it takes to reach expected productivity. Using Gallup’s range of one-half to two times annual salary, a 200-person workforce with 15% attrition and an average salary of $60,000 is moving between $900,000 and $3.6 million a year on replacement alone.
When your most experienced people leave, you lose critical know-how that is almost never documented: the judgment to resolve an incident, a client’s history, the reasoning behind a decision made three years ago.
Constant turnover creates uncertainty, overloads teams and reduces the commitment of those who stay. It is the most underestimated effect: every departure increases the probability of the next one in the same team.
Companies with high attrition find it harder to attract talent and build a solid reputation as an employer, which in turn makes every new hire more expensive and closes the loop.
There is no universal figure that works for every company, and you should be wary of anyone who gives you one. A “normal” rate depends on factors such as:
As a starting benchmark in the U.S., the Bureau of Labor Statistics recorded 63.2 million total separations in 2024, an average of 3.3% of employment every month. The same release shows how much the industry changes everything: arts, entertainment and recreation ran at 6.0% a month and leisure and hospitality at 5.6%, while finance and insurance (1.9%), private educational services (2.3%) and information (2.7%) sat at the bottom. Comparing your figure with the national average without correcting for industry is the fastest way to reach the wrong conclusion.
What matters is not just the number, but the trend and the type of attrition. Three questions order the diagnosis better than any benchmark: is it up or down versus the previous two years? is it concentrated in one function or under one manager? who is leaving, the low performers or the people you cannot afford to lose? A stable, controlled rate is healthier than sudden spikes or departures of key profiles.
These five failures are what turn a useful indicator into a number nobody uses to decide anything:
Reducing attrition is not about applying a single measure, but about working structurally and in the right order.
Building a culture of respect, inclusion and trust is the foundation of any retention strategy. It is the right lever when attrition is spread across the whole organization rather than concentrated in one function, and it is assessed by how eNPS evolves, not by what leadership perceives.
Investing in continuous learning, career paths and growth opportunities is one of the most effective measures against voluntary attrition. It is a priority when your best performers are the ones leaving and when exit interviews mention stagnation. A role-based training plan and upskilling and reskilling paths are the format that best supports this lever.
Regular conversations let you spot problems before they turn into decisions to leave. It is the cheapest measure and the quickest to roll out: it works when attrition comes as a surprise, meaning managers did not see any of the recent departures coming. A system of effective employee feedback turns that conversation into a habit rather than an annual formality.
Work-life policies and flexible working models have a direct impact on retention, especially where there is sustained overtime or seasonal peaks in workload.
All four strategies work, but not all at once and not in every situation. This is the quick read:
| What your data shows | What to do first | Why in that order |
|---|---|---|
| Departures are concentrated in the first 12 months | Redesign onboarding and review the expectations set during hiring | This is the stretch where around 40% of total turnover is lost, and the quickest one to fix |
| Your highest-rated people are leaving | Individual development plans and internal mobility for that group | Dysfunctional attrition costs far more per person and is not fixed by across-the-board measures |
| The rate spikes under one specific manager | Leadership training and support for that manager | The data has already isolated the cause: acting on the whole workforce would dilute the effort |
| High attrition spread across the whole organization | Climate survey and a compensation review against the market | When there is no pattern by function or tenure, the cause is usually cross-cutting |
| Nobody saw any of the recent departures coming | Introduce regular check-in conversations and stay interviews | Without early information, any retention plan arrives late by definition |
Continuous learning is one of the most influential factors in retention. People who feel the company is investing in their growth show greater commitment and less intention to leave, and industry data backs it up: according to LinkedIn’s 2025 Workplace Learning Report, 88% of organizations say they are concerned about retention and offering learning opportunities is the number one retention strategy among respondents.
The same report points to where the gap is: only 36% of organizations have mature career development programs and barely 15% of employees say their manager helped them build a career plan in the last six months, five points down on the previous year. The intention to retain through learning is almost unanimous; the execution is not.
E-learning platforms such as isEazy LMS let you deliver flexible, accessible training adapted to different profiles and paces. Modern LMSs also include learning analytics that help you:
That last point is what connects learning and retention operationally: measuring employee performance alongside training activity lets you spot stagnation before it turns into a resignation letter.
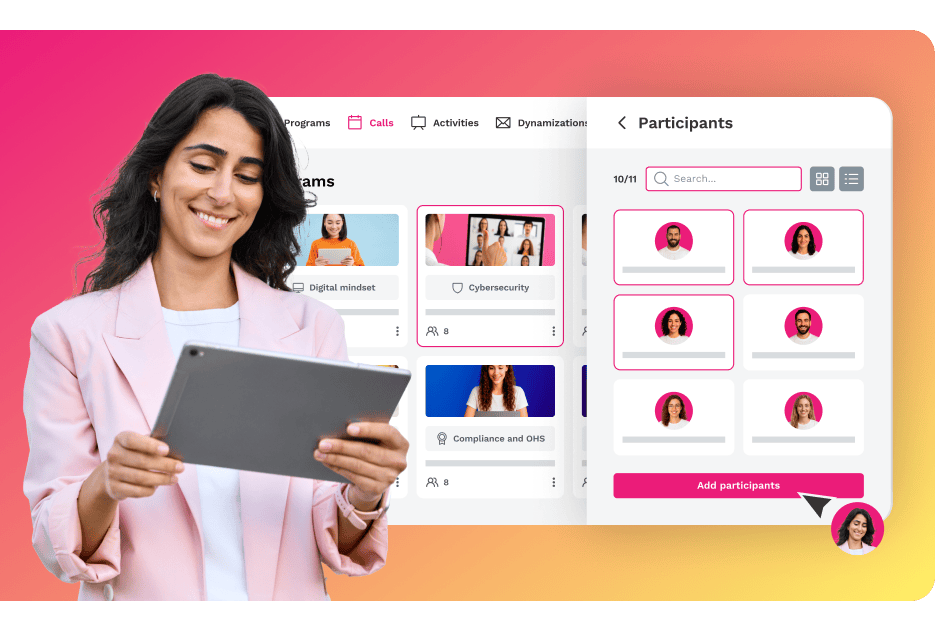
Pepco, a retail chain in the middle of a European expansion, is a good example of how to manage training when headcount grows fast and is spread across hundreds of stores: it centralized employee training management in an LMS to give every team consistent coverage. See how they did it →
The type of content matters too. Authoring tools such as isEazy Author make it easy to create interactive, practical and personalized materials. Relevant, applied learning increases motivation and reduces the frustration that usually precedes attrition; a generic catalog nobody finishes has the opposite effect and, on top of that, pollutes your participation metrics.
Career development programs strengthen the bond between the person and the organization. Among the most effective are:
For them to work they have to be visible: a learning path nobody knows exists retains nobody. If you want to go deeper, the employee engagement guide sets out how these programs are designed, and there are specific strategies to build employee loyalty that complement the learning side.
TEMPLATE
2026 Training Calendar
12 months, 12 key courses to develop the skills your team needs.
Download calendar


Training does not just reduce attrition: it also flags it. An LMS records actual behavior, not opinions declared in an annual survey, and that makes it a source of early signals almost no organization exploits. They should be treated as indications that open a conversation, never as an automatic prediction or as grounds for any decision about the person.
Cross-referencing this data with tenure and performance reviews lets you prioritize stay conversations with real criteria, instead of reacting once the resignation letter is already on the table.

The attrition rate should not be seen as a simple KPI, but as a decision-making tool. Analyzed alongside other indicators — engagement, performance, training participation, eNPS — it lets you:
The available evidence all points in the same direction. Gallup estimates the cost of replacing a person at one-half to two times their annual salary and found that 52% of voluntary departures were preventable. Work Institute’s annual exit interview analysis, reported by SHRM, puts career-related reasons as the leading cause of turnover. And LinkedIn confirms that offering learning is the most widely used retention strategy. The practical conclusion is that a substantial share of attrition is manageable, and that career development is the lever with the most evidence behind it.
The employee attrition rate is far more than a numerical indicator. It is a signal of how people feel inside the organization and of whether the company offers an attractive, fair environment with real opportunities to grow.
If you take away only three ideas: calculate the figure using average headcount and break it down by function, tenure and performance, because the aggregate is useless for deciding; translate it into dollars using Gallup’s range so you can defend the retention budget; and start with the stretch where your departures are concentrated, which in four out of ten cases is the first year.
Managing it proactively, supported by development strategies and the right learning tools, lets you reduce turnover, improve engagement and build stronger organizations. Tools such as isEazy LMS and isEazy Author help create the continuous learning environment that sustains development and talent retention.
The attrition rate is the percentage of people who leave an organization over a given period, voluntarily or involuntarily. It is calculated by dividing the departures in the period by the average headcount and multiplying by 100. Its value lies in what it reveals: a high rate usually points to problems with climate, leadership or a lack of career development, and a low one is not always a good sign if it comes with stagnation.
Attrition measures every departure from the organization, whether or not the role is backfilled afterwards. Turnover focuses on departures that require a replacement, meaning the full exit-and-hire cycle. In practice, attrition is used to analyze overall talent loss and turnover to assess hiring dynamics. They are complementary, and comparing them across companies without knowing which one is being measured leads to the wrong conclusions.
Divide the number of departures in the period by the average number of employees in that same period and multiply by 100. For example, 12 departures in an average workforce of 120 people gives 10% a year. Two details matter: always use the average headcount rather than the final one, because the figure gets distorted in companies that are growing or shrinking; and keep the same criteria on temporary contracts and contract endings across every period you plan to compare.
There is no universal figure: it depends on the industry, the type of roles and where the company is in its lifecycle. As a reference, the U.S. Bureau of Labor Statistics recorded 63.2 million total separations in 2024, an average of 3.3% of employment per month, with leisure and hospitality well above that and sectors such as finance and insurance or private education well below. More than the number, three things matter: the trend versus previous years, whether it is concentrated in one function or one manager, and whether the people leaving are key profiles.
No. The churn rate measures customer or user loss, while the attrition rate measures employees leaving. The formula looks similar, but they answer different business questions and should not be mixed in the same dashboard. The most common mistake is importing the commercial churn methodology into the people function and counting hires and exits in the same calculation, which produces a figure that is not comparable with any previous period.
Multiply the number of annual departures by the average annual salary and by a replacement factor. Gallup puts that cost at between one-half and two times annual salary depending on the role, so use the low end for operational profiles that are easy to fill and the high end for technical positions or middle managers. A company with 12 departures a year, an average salary of $60,000 and a conservative factor of 0.75 would be absorbing around $540,000 a year in replacement costs.
Yes, and it is the lever with the most evidence behind it. According to LinkedIn’s 2025 Workplace Learning Report, offering learning opportunities is the number one retention strategy among the organizations surveyed, and Work Institute’s exit interview analysis reported by SHRM puts career-related reasons as the leading cause of turnover. The nuance is that training retains people when it is visible, tied to a career path and the manager is involved in it.
Turnover, engagement or eNPS, performance reviews, training participation and completion, and workplace climate indicators. On its own, the attrition rate tells you how many people are leaving, but not who or why. Cross-referencing it with performance lets you distinguish functional from dysfunctional attrition, and breaking it down by tenure reveals whether the problem is in onboarding or in medium-term development, which are two problems with completely different solutions.

Automate processes, access 600+ ready-to-use courses, or create your own content with the help of AI.
Request a demoContact us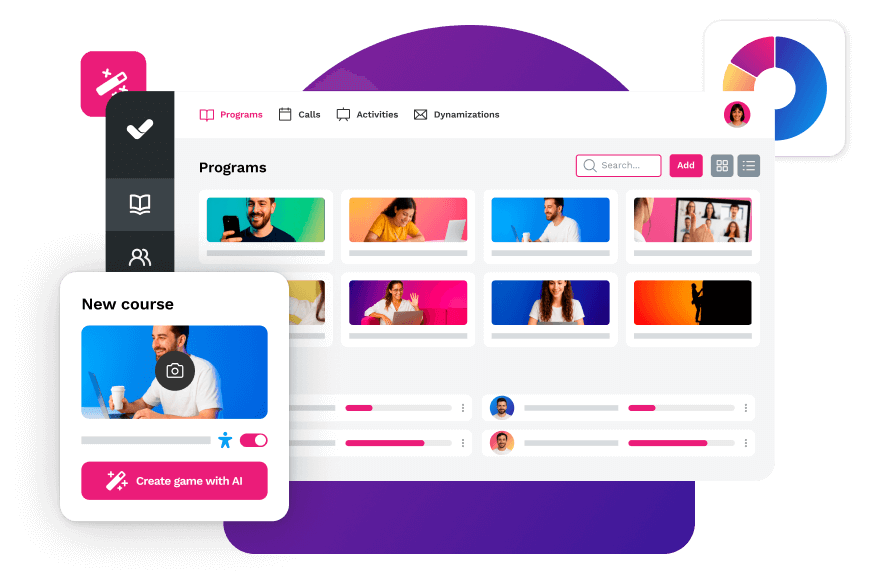


Streamline your training management
Experience the power of AI in an LMS that has it all