


CASE STUDY
ING: All the knowledge, communication, and training in one app.

Author
The #1 AI-powered authoring tool on the market

Factory
Custom e-learning content factory

Skills
Comprehensive power skills course catalog

LMS
All-in-one LMS platform with AI

Engage
App for managing frontline teams

Game
Gamification app for business
FEATURES

AINew
Unlock your full potential and speed up course creation with artificial intelligence.
Accessibility
Automatically meet accessibility guidelines—without sacrificing interactivity!

Interactivity
Boost engagement with interactive, ready-to-use activities that make learning fun.

Course Creation
Reduce the time it takes to create your e-learning courses with our authoring tool.

Distribution
We offer you different distribution options, so that nothing can stop you.

SCORM
Publish your course in SCORM format and share it on any LMS.
SERVICES

Instrucional Design
Surprise your students with multimedia and interactive content.

Custom Courses
We create e-learning courses for you—tailored to your needs and hassle-free!

Virtual Reality
Turn learning into an immersive experience.

Custom Avatars
Give your courses and videos a unique touch with personalized avatars.

Audiovisual FactoryNew
Turn training into something dynamic and visual with engaging videos.
CATALOG
Course catalog
Over 600 skills and competency courses to help you adapt to your team's needs.

Microsoft Copilot AcademyNew
Your professionals will learn how to apply Copilot AI to key processes within your organization.
Artificial Intelligence Academy
Train your teams in the practical use of AI to boost productivity and innovation in your company.

Cybersecurity Academy
Capacita a tu empresa con el catálogo más completo en seguridad digital corporativa.
FEATURES

Quizzes & Games
Turn your training into an engaging Q&A game.

Challenges & Competitions
Enhance learning through friendly peer challenges.
Rewards & Incentives
Motivate employees with points, levels, and leaderboards.
Social & Collaborative
Strengthen team connections with interactive social dynamics.

KPIs & Analytics
Track and optimize your training initiatives instantly and effortlessly.

Use cases
Choose the solution that best fits your needs

Industries
Solutions for all types of industries
USE CASES
Onboarding
Facilitate the onboarding process, productivity and engagement of your new employees.
Upskilling
Boost your team's skills and prepare them for the challenges of the future with upskilling.
Microlearning
Discover all the advantages of microlearning and boost your training results.
Gamification
Enjoy addictive training that will get your professionals hooked.

Internal Communication
Improve communication in your company and enjoy an aligned and committed team.

Mobile learning
Agile, flexible, and interactive learning—built for today’s digital-first workforce.
INDUSTRIES

Banking and financial services
Training in compliance, cybersecurity, customer service, and key skills development.

Pharmaceuticals and healthcare
Digital onboarding, regulatory updates, and ongoing training for healthcare staff.

Retail and consumer
Agile and scalable training for in-store, operational, and customer service teams.

Industry and manufacturing
Training in processes, safety, and corporate culture for distributed teams.

Education and training
Digital solutions for training centers, internal academies, and corporate universities.

Technology and telecommunications
Development of technical talent, digital skills, and upskilling and reskilling programs.
CLIENTS

MAPFRE
How MAPFRE turn e-learning into sales with isEazy

Pepco
A personalised learning experience for a growing team.

BBVA
Digitisation and creation of high quality e-learning content.

Shiseido
We increase the engagement of the training with a social and gamified app.

Telefónica
Large-scale reskilling for the company's digital transformation.
Vodafone
A personalised learning experience for a growing team.
More than 1,000 companies already rely on isEazy.


MEET ISEAZY

News
Find out the latest news about isEazy: press releases, partnerships, updates...

Contact
Leave us your personal details and we will contact you as soon as possible.
About isEazyNew
Find out more about our company.
Careers
We are looking for the best talent, join our team!

Partners
Become our partner and grow your business.
INTERESTING RESOURCES

Blog
The best content on e-learning: trends, tools and key strategies.
Whitepapers
Gain valuable insights and stay ahead of industry trends.
Product releases
The latest news and releases of our e-learning products and solutions.

Glossary
Definitions of the most commonly used terms and key industry concepts.
Guides
Discover the best step-by-step tips and tricks to optimize your L&D strategy.
Webinars
Video sessions on our products, trends and more

Comparatives
Compare e-learning solutions available on the market and choose the most suitable one.
STUDY
Download the free study, developed in collaboration with Microsoft, and discover the insights.

January 28, 2026
CONTENT CREATED BY:
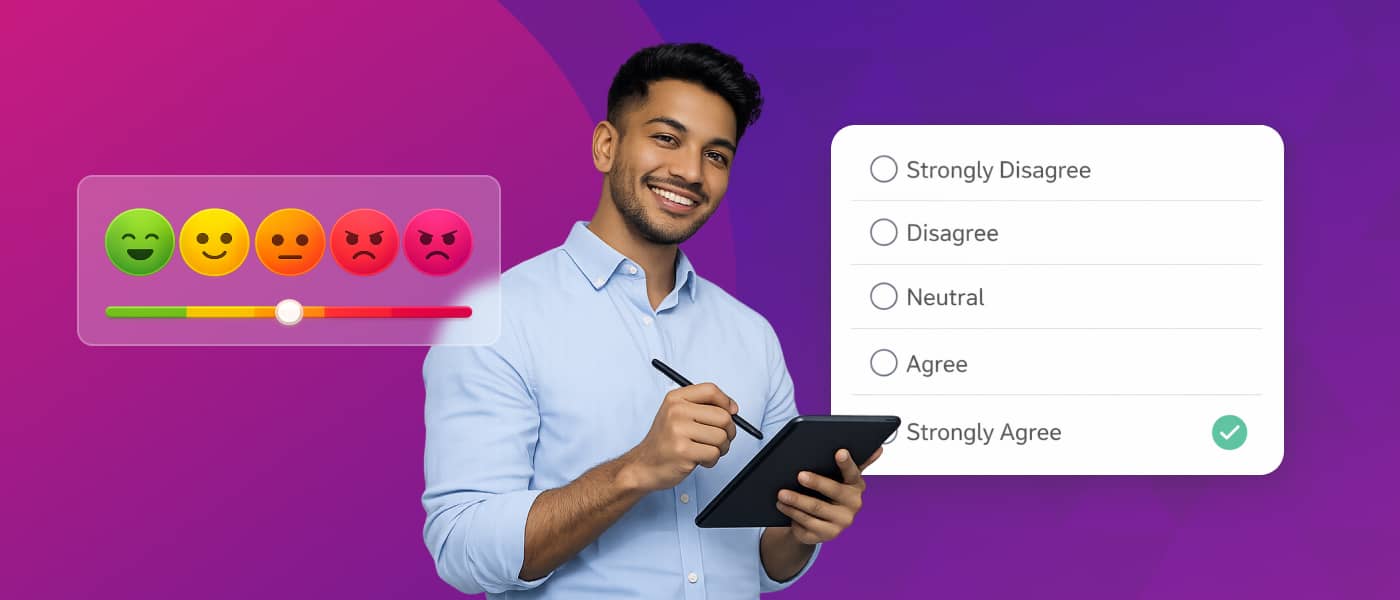
Table of contents
Measuring opinions, perceptions, and attitudes objectively is one of the biggest challenges in areas such as human resources, market research, and customer service. How can you really know what your employees think about the workplace climate? Are your customers satisfied with the service? How effective is an onboarding process? To answer these questions with concrete data, there is a tool that is as simple as it is powerful: the Likert scale.
You have probably seen it hundreds of times: “Strongly disagree / Disagree / Neutral / Agree / Strongly agree.” It appears in satisfaction surveys, performance evaluations, organizational climate studies, and, of course, market research. But what is truly interesting is not the scale itself, but what it allows you to achieve when applied correctly: turning subjective perceptions into measurable results, comparing different groups or time periods, identifying areas for improvement, and making decisions based on real evidence.
In this post, we explain what the Likert scale is, its most common types (3, 4, 5, or 7 points), how to create it step by step to apply it in different contexts such as marketing, HR, customer service, and, above all, how to interpret it so it becomes a useful tool within your organizational strategy.
The Likert Scale is a psychometric measurement tool that allows you to evaluate people’s opinions, attitudes, and perceptions in a quantifiable way. Created in 1932 by American psychologist Rensis Likert, it has become one of the most widely used methods in social research, marketing, and especially in training and talent development.
Unlike binary questions that only offer “yes” or “no” options, the Likert Scale allows participants to express their degree of agreement or disagreement with a given statement. The mechanism is simple: a statement is presented and participants indicate their level of agreement on a graded scale, typically with 5 or 7 points. For example, in response to the statement “The platform has an easy-to-use interface.”, respondents can answer from “Strongly disagree” to “Strongly agree”, with intermediate options in between.
The popularity of this methodology is no coincidence. Its features make it ideal for different areas. Some of the most important are:
Response options are arranged sequentially, creating a continuum from total disagreement to complete agreement. This structured format makes it easier for respondents to answer and for analysts to process the data later.
Although the most common version uses 5 points, the Likert scale can be adapted to 3, 4, 6, 7, or even more options depending on the specific needs of each evaluation. In corporate training, 5-point scales often offer the perfect balance between simplicity and detail.
No specialized knowledge is required to understand the results. Those analyzing responses can quickly identify areas for improvement and aspects that need adjustment.
It allows you to efficiently collect opinions from a large number of participants.
Choosing the right format depends on the objective of your evaluation and the level of detail you need. These are the most common types:
The simplest option, with alternatives such as “Agree”, “Neutral”, and “Disagree.” It is useful for quick evaluations where a general opinion is needed without going into nuances.
This version removes the neutral option, forcing participants to take a position. It is known as a “forced scale” and is effective when you need respondents to take a clear stance on critical aspects.
This is the most popular and balanced format. It offers options such as:
It provides enough detail without overwhelming respondents. It is ideal for evaluating services, products, measuring satisfaction with platforms, or collecting feedback on training resources.
It allows you to capture finer nuances of opinion, with two extreme options, two moderately extreme, two intermediate, and one neutral. It is recommended for more in-depth research or when you need to identify subtle differences in perception.
If you work in human resources, customer service, product development, or training, this tool should be part of your evaluation toolkit. There are many reasons, and all of them point to improving decision-making within your organization. Here are 5 of the most important:
Going beyond informal conversations or assumptions allows you to truly understand what your employees, customers, or stakeholders think about critical aspects of your organization. The Likert scale turns opinions into quantifiable data.
By evaluating different aspects separately, you can pinpoint exactly which elements are working well and which need attention. This information is invaluable for prioritizing investments and resources.
By using the same evaluation format in different contexts, you can compare results objectively and detect trends over time. This helps identify which initiatives or changes generate the greatest impact.
Likert scale surveys are quick to complete and people feel that their opinion is captured with nuance, not just with a simple “yes” or “no.” This sense of being heard increases participation and improves the quality of responses, strengthening a feedback culture.
It turns subjective opinions into numerical data that you can analyze statistically, build visual dashboards, and present to leadership. This strengthens the business case for any organizational improvement initiative and demonstrates the impact of HR actions.
Designing a good Likert scale survey requires methodology and attention to detail. These steps will guide you through the process.
Before you start writing questions, identify the specific goal of your evaluation. Do you want to measure overall satisfaction, applicability, quality of resources or products, usability, or impact? Keep the focus on one aspect or a group of related aspects.
For example, if you’re evaluating a digital onboarding course, you could focus on three dimensions: content quality, user experience, and perceived usefulness for the role.
Each item should be a concrete statement, not a generic question. Statements work better than questions because they allow respondents to rate their level of agreement more naturally. Avoid ambiguous wording, double negatives, or statements that cover multiple aspects at once.
Decide how many points your scale will have (3, 4, 5, or 7) and define the verbal labels for each level. Consistency is key: use the same number of options across all questions in the survey.
For corporate training, a 5-point scale is usually the most practical. Make sure to include a neutral option for cases where the participant doesn’t have a formed opinion.
Including both positive and negative statements helps avoid acquiescence bias. For example:
Run a pilot with a small group of participants. This helps you identify confusing questions, detect technical issues, and adjust the survey length. A survey that’s too long reduces response rates.
Seeing concrete examples helps you understand how to apply this methodology across different areas of people management.
Goal: measure employees’ perceptions of the work environment and organizational culture.
Goal: determine the level of satisfaction with products or services.
Goal: capture employees’ perceptions of their own development and the support they receive.
Goal: measure the effectiveness of the new-hire onboarding process.
Goal: measure how customers or users perceive the brand and its value proposition.
Goal: analyze customers’ perceptions of the quality and effectiveness of the sales process.
Collecting the data is only the first step. The real value is knowing how to interpret it to make informed decisions.
In a typical 5-point scale:
Add up all values for each question and divide by the number of responses. An average above 3.5–4 indicates a positive rating, while values below 3 point to areas for improvement.
Don’t rely only on the average. Look at how responses are distributed to better understand the context behind the results.
Compare results across different cohorts, editions, or participant groups. Look for correlations between variables.
If you include open-ended questions alongside the Likert scale, written comments help contextualize the numbers and explain the “why” behind the ratings.
| Item average (1–5) | What it means | Recommended action |
|---|---|---|
| 4.2 – 5.0 | Clear strength (strong positive consensus) | Maintain and replicate in other courses; identify what makes it work |
| 3.4 – 4.1 | Good result, but can be improved | Optimize: add examples, improve resources, adjust length or pacing |
| 2.6 – 3.3 | Warning zone (neutrality or divided opinions) | Review the item: detect friction points and cross-check with qualitative comments |
| 1.0 – 2.5 | Clear problem (evident dissatisfaction) | High priority: redesign content/activity or improve the platform experience |
Like any evaluation tool, it has strengths as well as aspects to consider.
In the field of corporate training, the Likert scale is a key tool for measuring employees’ perceptions, attitudes, and levels of agreement regarding different aspects of learning. It is not used solely to determine whether a course was “liked,” but to obtain structured data that supports decisions about the quality, relevance, and impact of training initiatives.
When applied correctly, it allows you to assess everything from the clarity of content and the practical usefulness of what was learned, to employees’ confidence in applying new skills in their roles. This makes it especially valuable in stages such as satisfaction evaluation (Kirkpatrick Level 1), perceived learning (Level 2), or even transfer to job performance, when behavior-oriented statements are used.
In addition, its simple and standardized format makes it easy to compare results across courses, groups, departments, or time periods. In this way, the Likert scale not only gathers opinions but also provides a quantitative foundation that helps identify areas for improvement, validate training decisions, and align the learning strategy with business objectives.
If you work in talent development, corporate training, or e-learning content design, this tool should be part of your evaluation toolkit. There are many reasons, all focused on improving the quality of your training programs. Here are 5 of the most important:
Going beyond completion rates or final test scores helps you understand whether the content truly resonates with participants, whether it is useful, and whether it generates the expected impact on job performance.
By evaluating different aspects of the course separately (content, format, navigation, applicability), you can pinpoint exactly which elements work well and which need adjustment. This information is invaluable for continuous improvement.
By using the same evaluation format across different courses or editions, you can compare results objectively and detect trends over time. This helps identify which methodologies or formats are better received.
Likert scale surveys are quick to complete, and employees feel their opinion is captured with nuance, not just with a “like” or “dislike.” This feeling of being heard increases participation and improves the quality of responses.
It turns subjective opinions into numerical data that you can analyze statistically, build visual dashboards, and present to leadership. This strengthens the business case for investing in training and demonstrates the ROI of your programs.
Maximize the effectiveness of your evaluations by following these proven recommendations:
Between 10 and 15 items is usually optimal. Longer surveys significantly reduce response rates and the quality of final responses.
Organize items into blocks (content, format, applicability, platform) to facilitate response flow and later analysis.
Briefly explain how to respond and what each level of the scale represents. Don’t assume everyone understands this intuitively.
If responses are anonymous, participants feel more comfortable giving honest and critical feedback, especially on sensitive topics.
Take advantage of your LMS platform’s features so the survey appears naturally at the end of the course or at strategic points in the learning journey.
Communicate to participants what improvements have been implemented based on their feedback. This reinforces the importance of their input and increases participation in future evaluations.
The Likert scale is powerful, but it should not be your only source of information. Combine it with completion rates, knowledge assessment results, behavioral observation, and qualitative interviews.
| Scale type | When to use it in e-learning | Main advantage |
|---|---|---|
| 3-point | Learning nuggets, microlearning, quick post-module surveys | Maximum simplicity (ultra-fast response) |
| 4-point (forced) | When you need a clear decision (e.g., real usefulness, recommendation, critical perception) | Removes the “neutral” option and reduces evasive answers |
| 5-point (standard) | General evaluation of e-learning courses, satisfaction, user experience, content quality | Perfect balance between detail and ease |
| 7-point | More detailed analysis or strategic programs where you want to detect subtle differences between editions/groups | Greater precision to capture nuances |
Technology makes it much easier to create, distribute, and analyze Likert scale surveys. Tools like Google Forms, Typeform, SurveyMonkey, and Microsoft Forms offer ready-made templates for Likert scales and streamline both the design process and the visual analysis of results.
When it comes to training specifically, many learning management systems include or integrate with survey tools to evaluate your programs. This allows you to fully automate the process: surveys are sent automatically upon course completion and results feed directly into your training reports.

Beyond one-off studies, the Likert scale is widely used to analyze perceptions, behaviors, and levels of agreement across multiple key areas of a company. Its value lies in turning subjective opinions into comparable data that supports strategic decision-making.
It helps measure how the audience perceives the brand in dimensions such as trust, differentiation, message consistency, relevance, and positioning against competitors. This makes it easier to adjust communication and branding strategies.
It measures customer perceptions at different touchpoints: ease of purchase, clarity of information, service received, response times, and issue resolution. It helps identify friction points in the customer journey.
It evaluates how customers perceive the sales process: understanding of needs, clarity of proposals, level of guidance, professionalism of the sales team, and ease of making purchasing decisions.
It is used to assess the experience with provided services: speed, effectiveness, service quality, follow-up, and whether expectations were met. It is key for continuous improvement models and quality control.
It measures whether information flows clearly and in a timely manner within the organization. Aspects such as transparency, message consistency, access to information, and understanding of priorities are analyzed.
It helps understand how values, behaviors, and unwritten norms within the company are perceived. It measures aspects such as collaboration, trust, innovation, results orientation, and recognition.
It gathers team perceptions about clarity of direction, support received, consistency in decision-making, listening skills, and the creation of a healthy work environment.
When new technologies or operational changes are implemented, the Likert scale helps measure perceived ease of use, real usefulness, level of adoption, and barriers encountered.
It evaluates factors such as workload, work–life balance, perceived stress, support from the work environment, and sense of stability.
After launching organizational changes, new policies, or corporate projects, it measures perceptions of their clarity, impact, alignment with objectives, and level of acceptance among employees.
Beyond post-course evaluation, this methodology has multiple applications within the organizational learning ecosystem.
Before designing a program, use the Likert scale to measure perceived proficiency levels across different competencies. This helps prioritize content and adjust the depth of coverage.
It evaluates cultural aspects related to training: manager support, time available for learning, and perception of the value of training within the organization.
Weeks or months after the course, measure the extent to which participants are applying what they learned. This reveals the real effectiveness of training beyond immediate satisfaction.
It collects feedback on the quality of facilitation in in-person courses or live online sessions: clarity of explanations, ability to motivate, handling of questions, etc.
When implementing a new LMS platform or updating an existing one, the Likert scale helps identify friction points in the user experience from the employees’ perspective.
Knowing the most frequent pitfalls will help you design more effective evaluations.
Problematic example: “The course was interesting and the platform was easy to use.”
If someone answers “agree,” are they referring to the content, the platform, or both? Split this into two separate items to obtain clear information.
Changing the number of options or the labels throughout the survey confuses participants and complicates analysis. Keep consistency across the entire evaluation.
Problematic example: “The course was pretty good.”
What does “pretty good” actually mean? Statements must be concrete and specific so responses can be interpreted correctly.
This creates acquiescence bias. Alternate positive and negative statements to obtain more thoughtful and genuine responses.
Launching a survey without testing it with a small group can lead to confusing questions, technical errors, or discovering it’s too long after hundreds of people have already responded.
Collecting feedback and not acting on it creates frustration among participants, who may stop responding in the future. Always communicate what actions are taken based on the evaluations.
To make the most of its potential, the Likert scale should be part of a broader ecosystem for measuring training effectiveness.
Integrate the Likert scale across the different levels:
Level 1 – Reaction: Measure immediate satisfaction with the course using items related to content, format, and overall experience.
Level 2 – Learning: Although knowledge assessments are common here, you can include Likert items about perceived learning.
Level 3 – Behavior: Use the Likert scale to evaluate how frequently learned skills are applied on the job after a period of time.
Level 4 – Results: Measure perceived impact on business outcomes through items related to improvements in productivity, quality, or efficiency.

Combine evaluations at the end of each course (immediate feedback) with quarterly or annual surveys about the overall training program. This provides both a tactical and a strategic perspective.
Integrate Likert scale data into dashboards that also include completion rates, training hours per employee, investment, and other KPIs. This holistic view enables informed decisions about your L&D strategy.

Collecting feedback from your training programs is just as important as designing them well. Without data on how your teams experience them, it’s hard to know what’s working, what needs improvement, and how to prove the real value of your training.
Adding Likert scale questions to your post-course evaluations is a simple and effective way to turn perceptions into actionable data: spotting friction points, measuring satisfaction, tracking progress across iterations, and making decisions based on real evidence.
The key isn’t just collecting responses — it’s doing so at the right time, with the right questions, and consistently. The more seamlessly evaluation is built into the learning journey, the higher your response rates and the more reliable the insights you’ll get.
Technically, a Likert item or question is a single statement that is rated on a scale. A Likert scale, properly speaking, is a set of multiple items that measure the same construct and whose results are combined to produce an overall score. In practice, the term is often used interchangeably.
The 5-point scale is the most commonly used because it provides enough granularity without overwhelming respondents. The 7-point scale offers more nuance but can create confusion about the differences between adjacent levels. For corporate training, 5 points is usually the most balanced option.
It depends on your objective. A neutral option (odd-numbered scales) allows genuine responses from people who do not have a formed opinion. Even-numbered scales (without neutral) force respondents to take a position, which can be useful when you truly expect an opinion, but may lead to random answers if someone genuinely doesn’t know what to say.
Central tendency bias can be reduced by using clear and specific statements, alternating positive and negative items, providing context about the importance of honest answers, and ensuring anonymity when appropriate.
There is no magic number, but between 10 and 15 items is usually effective. More than 20 questions can significantly reduce response rates. Prioritize quality over quantity: a few highly relevant questions are better than many generic ones.
Absolutely — and it’s highly recommended. Likert questions give you the numbers, while open-ended questions provide context and the “why.” This combination delivers a richer and more complete picture.
WEBINAR ONDEMAND
Games, exercises, and assessments automatically generated with isEazy Author’s AI.
Watch webinar

Adapt learning to your audience’s needs and training goals
Offer a personalized learning experience tailored to each employee with isEazy


Adapt learning to your audience’s needs and training goals
Offer a personalized learning experience tailored to each employee with isEazy