WHITEPAPER
How to create an effective online onboarding plan

Brain
The first AI trained to teach

Author
The #1 AI-powered authoring tool on the market

Factory
Custom e-learning content factory

Skills
Comprehensive power skills course catalog

LMS
All-in-one LMS platform with AI

Engage
App for managing frontline teams
Product

What is Brain?
Everything you need to know about the first AI trained to teach.

How does it work?
Adaptive, conversational, and contextual. That’s learning with Brain.

Security
Why your company’s knowledge never leaves your environment or trains other models.

Comparison
Discover what sets isEazy Brain apart from other AI solutions.

Frequently Asked Questions
Want to learn more? Find answers to all your questions about isEazy Brain here.
FEATURES

AINew
Unlock your full potential and speed up course creation with artificial intelligence.

Accessibility
Automatically meet accessibility guidelines—without sacrificing interactivity!

Interactivity
Boost engagement with interactive, ready-to-use activities that make learning fun.

Course Creation
Reduce the time it takes to create your e-learning courses with our authoring tool.

Distribution
We offer you different distribution options, so that nothing can stop you.

SCORM
Publish your course in SCORM format and share it on any LMS.
SERVICES

Instrucional Design
Surprise your students with multimedia and interactive content.

Custom Courses
We create e-learning courses for you—tailored to your needs and hassle-free!

Virtual Reality
Turn learning into an immersive experience.

Custom Avatars
Give your courses and videos a unique touch with personalized avatars.

Audiovisual FactoryNew
Turn training into something dynamic and visual with engaging videos.
CATALOG

Course catalog
Over 600 skills and competency courses to help you adapt to your team's needs.
Microsoft Copilot AcademyNew
Your professionals will learn how to apply Copilot AI to key processes within your organization.

Artificial Intelligence Academy
Train your teams in the practical use of AI to boost productivity and innovation in your company.

Cybersecurity Academy
Capacita a tu empresa con el catálogo más completo en seguridad digital corporativa.
FEATURES

Learning platform
Manage all your training from one place

Analitycs
Measure the impact of your training

Learning Experience
Offer a unique learning experience to your team
Content Library
Choose from hundreds of expert-created courses
Authoring Tool
Create your own content—faster than ever

Use cases
Choose the solution that best fits your needs

Industries
Solutions for all types of industries
USE CASES

Onboarding
Facilitate the onboarding process, productivity and engagement of your new employees.

Upskilling
Boost your team's skills and prepare them for the challenges of the future with upskilling.

Microlearning
Discover all the advantages of microlearning and boost your training results.

Gamification
Enjoy addictive training that will get your professionals hooked.

Internal Communication
Improve communication in your company and enjoy an aligned and committed team.

Mobile learning
Agile, flexible, and interactive learning—built for today’s digital-first workforce.
INDUSTRIES

Banking and financial services
Training in compliance, cybersecurity, customer service, and key skills development.

Pharmaceuticals and healthcare
Digital onboarding, regulatory updates, and ongoing training for healthcare staff.

Retail and consumer
Agile and scalable training for in-store, operational, and customer service teams.

Industry and manufacturing
Training in processes, safety, and corporate culture for distributed teams.

Education and training
Digital solutions for training centers, internal academies, and corporate universities.

Technology and telecommunications
Development of technical talent, digital skills, and upskilling and reskilling programs.
CLIENTS

MAPFRE
How MAPFRE turn e-learning into sales with isEazy

Pepco
A personalised learning experience for a growing team.

BBVA
Digitisation and creation of high quality e-learning content.

Shiseido
We increase the engagement of the training with a social and gamified app.

Telefónica
Large-scale reskilling for the company's digital transformation.

Vodafone
A personalised learning experience for a growing team.
More than 1,000 companies already rely on isEazy.





MEET ISEAZY

Events
Discover our upcoming events and connect with the future of e-learning.

News
Find out the latest news about isEazy: press releases, partnerships, updates...

Contact
Leave us your personal details and we will contact you as soon as possible.
About isEazyNew
Find out more about our company.

Careers
We are looking for the best talent, join our team!

Partners
Become our partner and grow your business.
INTERESTING RESOURCES

Blog
The best content on e-learning: trends, tools and key strategies.

Whitepapers
Gain valuable insights and stay ahead of industry trends.

Product releases
The latest news and releases of our e-learning products and solutions.

Glossary
Definitions of the most commonly used terms and key industry concepts.

Guides
Discover the best step-by-step tips and tricks to optimize your L&D strategy.

Webinars
Video sessions on our products, trends and more

Comparatives
Compare e-learning solutions available on the market and choose the most suitable one.


WEBINAR
Master AI in isEazy Author in under an hour.




GUIDE
Prepare your organization to comply with the new AI regulations

Stay up to date with all our latest news
 Subscribe to our newsletter
 Stay up to date with all our latest news

September 24, 2026

CONTENT CREATED BY:

Table of contents
Onboarding metrics are the indicators that allow organizations to measure whether their onboarding process is working: how quickly new employees reach productivity, how many stay, and how they rate their initial experience. Without them, improving onboarding is little more than guesswork.
In this article, you’ll find the essential metrics every HR and L&D team should be tracking, how to calculate them, and which tools make it easier to monitor them in a corporate environment.
Onboarding is the systematic process of integrating new employees into an organization: orientation, initial training, and ongoing support during the first few months. Measuring its effectiveness is not optional: according to the Society for Human Resource Management (SHRM), organizations with structured onboarding programs improve retention by 82% and new employee performance by 70%.
Yet the integration process starts before day one: preboarding and upfront planning directly influence first-90-day metrics. And still, according to Gallup’s onboarding report, only 12% of employees believe their company does a great job of onboarding them.
Metrics act as a compass: they identify where you’re losing talent, when training isn’t working, and where the process needs to be redesigned. Without data, improvement decisions are subjective. With metrics, they’re actionable.
For learning and development professionals, onboarding metrics are especially critical because they reveal whether training content is actually accelerating integration. A new employee who completes 100% of their e-learning modules but still hasn’t reached expected productivity after 60 days signals that the instructional design needs rethinking. Data connects training to real-world performance.
Organizations often overlook the details of their onboarding processes. Tracking metrics makes it possible to pinpoint exactly where new employees struggle — whether it’s in the initial technical training, cultural integration, or lack of manager support.
According to BambooHR, a well-designed onboarding process can cut time to productivity by 50% compared to unstructured ones. That difference is only visible when it’s measured.
31% of new employees leave an organization within the first six months when onboarding is poor (BambooHR, 2024). Early turnover has a direct cost: between 50% and 200% of the employee’s annual salary, factoring in recruitment, training, and lost productivity. Onboarding metrics allow you to spot warning signs before the employee decides to leave.
L&D teams need to demonstrate ROI. Onboarding metrics directly connect training investment to measurable business outcomes: lower turnover, higher productivity, greater engagement. Without these metrics, the real impact of onboarding on employee performance remains invisible to leadership.
These are the fundamental metrics every corporate onboarding program should monitor, along with their definition, formula, and industry benchmark.
Measures how many days it takes a new employee to perform at the expected level for their role, with little or no supervision. It’s the most direct indicator of onboarding effectiveness and training design quality.
How to calculate it: add up the days to productivity for all new hires in a period and divide by the total number of hires. Define the “expected productivity” point specifically per role, in collaboration with line managers. For example, in a sales role it could be measured by number of leads generated; in customer service, by resolution times or CSAT score.
Benchmark: for technical roles, the industry standard is 3–6 months; for sales, 3–4 months; for customer service positions, 1–3 months. If your average exceeds these ranges, the training process needs reviewing.
Measures what percentage of recently hired employees leave the organization within a defined period. In onboarding analysis, the focus is on turnover in the first 90 days, the most critical window. It’s important to distinguish between two types:
Both types provide different signals about which part of the process needs improvement. Tracking them separately is essential.
Formula: (New hires who leave in the period / Total new hires) × 100.
Benchmark: an early turnover rate above 15% in the first 90 days is a warning sign that requires immediate review of the onboarding process.
Beyond the turnover rate, it’s essential to analyze when within the onboarding period departures happen. Most cluster at specific moments: the end of the first week (reality shock), the end of the first month (lack of perceived progress), and days 60–90 (if the employee feels they don’t fit in with the team or culture).
Identifying these thresholds enables targeted preventive interventions: a check-in call at the end of week one, a feedback meeting at month one, or a cultural reinforcement at day 60. A structured onboarding plan with defined milestones is the primary tool for managing these thresholds.
Measures the employee’s perceived experience during the onboarding process through specific surveys. The most common model is the onboarding eNPS: “Would you recommend this onboarding process to a future colleague?” (0–10 scale). Applied at three moments: end of week 2, end of month 1, and end of month 3. Surveys should also include open-ended questions about what worked well and what caused confusion.
For frontline or deskless workers, mobile-first platforms like isEazy Engage allow collecting this feedback directly from a smartphone, with micro-surveys integrated into the onboarding flow itself.
eNPS formula: % Promoters (9–10) − % Detractors (0–6). Benchmark: eNPS > 0 is positive; > 20 indicates an excellent program. Organizations that monitor onboarding progress and act on results report a 54% increase in new employee engagement.

The percentage of new employees who complete mandatory training modules within the established timeframe. It’s the most specific metric of formative onboarding and the best indicator of whether the program design is generating real engagement or just being treated as a formality.
It’s worth breaking it down by content type (compliance, product training, corporate culture) to identify which parts of the learning path generate the most dropoff.
Formula: (Employees who complete the program / Total enrolled) × 100.
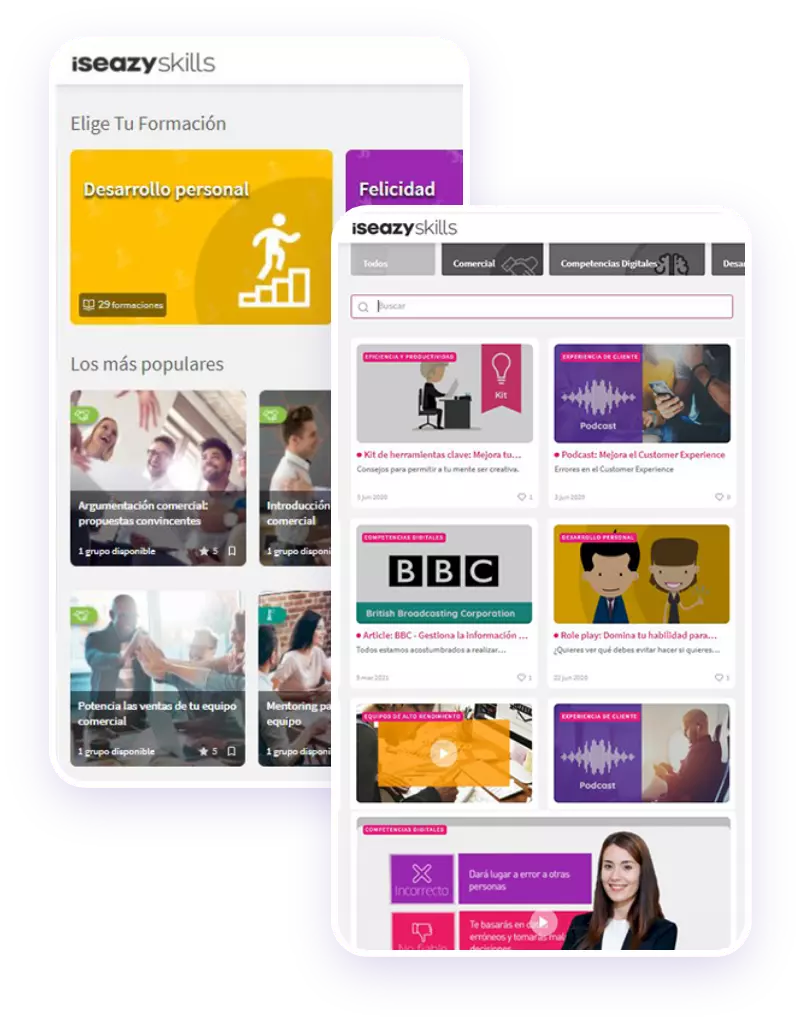
A well-configured LMS automatically generates this report by module, cohort, and department. With isEazy Skills, you can also assign personalized learning paths by role. It’s also worth tracking the final assessment pass rate: completing modules doesn’t guarantee content retention.
Benchmark: the recommended target is >90% completion. Companies that reach it are 70% more likely to have engaged new employees (SHRM). Below 70% requires a review of the training design.
Covers all resources invested in bringing a new employee on board: training materials, HR team and direct manager time, technology used, and lost productivity during the ramp-up period. Knowing this figure helps identify which process components are most costly (and whether that cost is justified), and compare it across different profiles, departments, or locations.
Formula: Total program cost in the period / Number of new hires. Designing a solid onboarding plan allows organizations to scale onboarding without costs growing proportionally to headcount.
| Metric | Formula | Recommended benchmark |
|---|---|---|
| Time to productivity | Sum of days to productivity / number of hires | 3–6 months (technical roles); 1–3 months (customer service) |
| Early turnover rate | (Leavers in period / total hires) × 100 | <15% in first 90 days; >20% is a critical warning sign |
| Onboarding eNPS | % Promoters (9–10) − % Detractors (0–6) | eNPS > 0 positive; > 20 excellent |
| Training completion rate | (Employees who complete / total enrolled) × 100 | >90% target; <70% requires instructional design review |
| Satisfaction at key milestones | Average score from surveys at week 2, month 1, and month 3 | Score >4/5; upward trend across the three checkpoints |
| Onboarding cost per employee | Total program cost / number of new hires | Variable by sector; ≥20% reduction in year 2 = improvement |
Once the fundamental metrics are in place, more mature HR and L&D teams incorporate advanced indicators that provide a fuller picture — not just whether onboarding is working, but why it works and how to improve quality over time.
Time to productivity measures speed, but not quality. A new employee might hit the expected pace on schedule while still making recurring errors, generating rework, or requiring constant supervision. To measure the quality of initial performance, integrate into onboarding analytics:
Integrating these performance evaluations into onboarding analytics allows you to track the long-term effectiveness of training programs and anticipate ongoing support needs.
In environments where employees aren’t in the office from day one, onboarding engagement can’t be measured by physical attendance. It’s measured by digital interaction:
Platforms like isEazy Engage generate actionable analytics on all these interactions — channel activity, content engagement, and team connectivity — allowing HR managers to act immediately if they detect employees with no activity in the first few days.

Beyond e-learning modules, onboarding processes typically include live sessions (team introductions, welcome events, culture workshops). The attendance rate for these activities is a direct indicator of how well the new employee is integrating into the team and organization.
Formula: (Actual attendees / Invited attendees) × 100, per event.
A consistently low attendance rate may indicate that events aren’t well communicated, are scheduled at inconvenient times, or that the initial workload is too heavy for new hires to participate.
Measures how quickly and thoroughly new employees adopt the work tools they need for their role: CRM, ERP, management platforms, communication tools. Especially relevant in organizations with complex technology stacks.
Practical indicators: % of new hires who complete the initial tool setup in week 1; % actively using their main role tool in week 2; number of IT support tickets raised by new hires.
A high volume of IT support tickets in the first few weeks typically indicates that tool training is insufficient or too theoretical.
One of the least-used but most predictive metrics for onboarding success. It measures the new employee’s perception of the quality of support received from their direct manager during the onboarding process.
Collected through a specific question in the onboarding survey: “How would you rate the support you received from your direct manager during your onboarding?” (1–5 or 0–10 scale). Managers with consistently low scores point to a leadership issue that training content alone can’t solve.
According to Gallup, 70% of the variance in employee engagement is explained by direct manager quality. During onboarding, this impact is even more pronounced.
| Advanced metric | What it measures / Practical indicator | Warning sign |
|---|---|---|
| Initial performance quality | 30/60/90-day performance review + rework rate | Score <3/5 at 30-day review or rework rate >20% |
| Digital engagement index | % accessing training in first 5 days + channel interactions | No platform activity in the first 3 working days |
| Manager response time | Average hours to respond to new hire queries | >24h average in the first 2 weeks |
| Activity attendance rate | (Actual attendees / invited) × 100, per event | <75% attendance consistently in the first 4 weeks |
| Tool adoption rate | % actively using main role tool in week 2 | <60% active adoption by week 2 |
| Manager Effectiveness Score | Manager support score from new hire (0–10) | Score <6/10 or downward trend across cohorts |
Before measuring, you need to define what success means for your organization. That means aligning onboarding metrics with business goals: do you want to reduce turnover by 20%? Cut time to productivity by two weeks? Raise completion rates to 90%? Each goal requires its own metric and baseline.
A structured onboarding plan is the reference document that operationalizes these metrics: it defines concrete milestones (days 7, 30, 60, 90), assigns owners, and sets measurement checkpoints.
Onboarding measurement tools should integrate into the HR technology stack. The most common are:
Continuous improvement of onboarding is only possible when the data cycle is closed: measure → analyze → adjust → measure again. There’s no need to wait for year-end; with real-time metrics, HR teams can detect deviations in the first 30 days and correct them before they impact retention.
It’s also worth comparing the evolution across employee cohorts: did the Q3 intake reach productivity faster than Q1? Why? Cohort analysis reveals which process changes have real impact — an approach that’s particularly valuable for improving long-term talent retention.
Having the data isn’t enough — you need to know how to interpret it. These are the key thresholds that should trigger a process review:
When any of these thresholds is exceeded, the first step is to audit the process by phase: is the problem in preboarding, in the first 30 days, or in the consolidation phase (30–90 days)? For frontline teams, onboarding and ongoing training should be designed as a continuum, not as two separate stages.
Clarel, a drugstore chain with over 1,000 stores, built its onboarding process on a mobile-first platform that allowed new point-of-sale employees to be onboarded simultaneously across its entire network. The result was an 84% engagement rate in the training program, with a completion rate well above the retail sector benchmark — proving that when the format fits the profile, onboarding metrics improve significantly.
CASE STUDY
How Clarel trained professionals at +1,000 points of sale with mobile learning


Onboarding metrics are the starting point for turning new employee integration into a genuine competitive advantage. Without data, onboarding is intuition. With data, it’s strategy.
With isEazy, you can design training onboarding programs, track each new employee’s engagement in real time, and act on results before they impact retention. From assigning learning paths to monitoring individual progress, everything is logged and actionable.
Want to see how it works? Discover isEazy’s onboarding solution and request a personalized demo for your team.
Onboarding metrics are key performance indicators (KPIs) that measure the effectiveness of a company’s employee integration process. The most relevant ones include: time to productivity, 90-day retention rate, employee satisfaction (eNPS), training completion rate, and cost per hire. Together, they give HR and L&D teams actionable data to continuously improve the onboarding experience.
The main onboarding KPIs to track are: time to productivity (how long it takes new hires to reach expected performance), early turnover rate (% who leave within the first 90 days), onboarding eNPS (employee satisfaction score), training completion rate (% who finish mandatory modules on time), and cost per onboarded employee. For remote teams, also track the digital engagement index and manager effectiveness score.
A healthy 90-day retention rate sits above 85%. A rate below 75% is a warning sign that requires an immediate review of the onboarding process. To improve it: define clear expectations before day one (preboarding), establish check-in touchpoints at the end of week 1, month 1, and month 3, ensure managers are actively supporting new hires, and use pulse surveys to detect disengagement early.
An LMS (Learning Management System) is one of the most effective tools for measuring onboarding metrics. It automatically tracks training completion rates, time spent per module, assessment scores, and learning progress by cohort, role, or department — without manual data consolidation. Combined with pulse survey tools for eNPS and engagement platforms for digital interaction data, an LMS gives HR and L&D teams a full picture of onboarding effectiveness in real time.

Discover how to train, communicate, and support your professionals from day one, no matter where they are!
Request a demo
Only 12% of workers are satisfied with their onboarding process
Avoid first-day frustration and take engagement, productivity, and retention to the next level.
Only 12% of workers are satisfied with their onboarding process
Avoid first-day frustration and take engagement, productivity, and retention to the next level.